The network for creativity
Join 1.25M professional creatives like you
Connect with clients, get discovered, and run your business 100% commission-free
Creatives on Contra have earned over $150M and we are just getting started
Back to feedPost

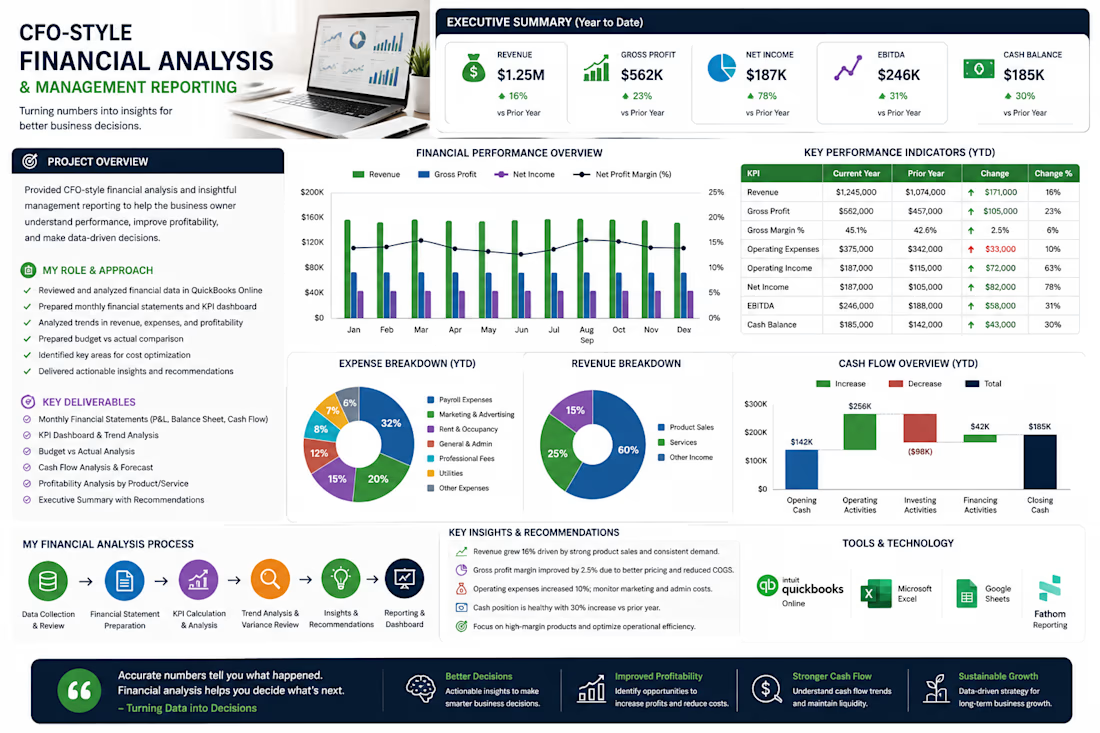
I built a sales performance report from raw transactional data, tracking 18 orders across six product categories, four regions, and six months (Jan–Jun 2024).
Starting from row-level order data (order ID, product, category, region, units sold, revenue, cost, and profit), I used SUMIF formulas to build a Pivot Summary tab that rolls the data up into a single-page executive report — monthly revenue and profit trends, regional performance, category breakdown, and key KPIs like average order value and profit margin.
The result: a clear, one-page view that lets a business owner see at a glance where revenue is coming from and how profitable it actually is — without digging through raw rows.


The network for creativity
Join 1.25M professional creatives like you
Connect with clients, get discovered, and run your business 100% commission-free
Creatives on Contra have earned over $150M and we are just getting started





Related posts

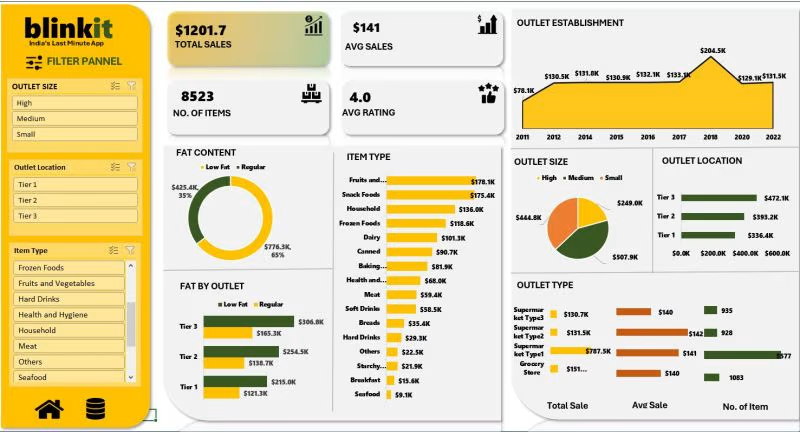

Analyzed cafe sales data to identify sales trends, popular products, revenue patterns, and key business insights. Cleaned and formatted the dataset, organized the data for analysis, and created clear visualizations to present the findings.
Tool: Microsoft Excel 2021
Project type: Personal portfolio project, not a client project.