The network for creativity
Join 1.25M professional creatives like you
Connect with clients, get discovered, and run your business 100% commission-free
Creatives on Contra have earned over $150M and we are just getting started
Back to feedPost

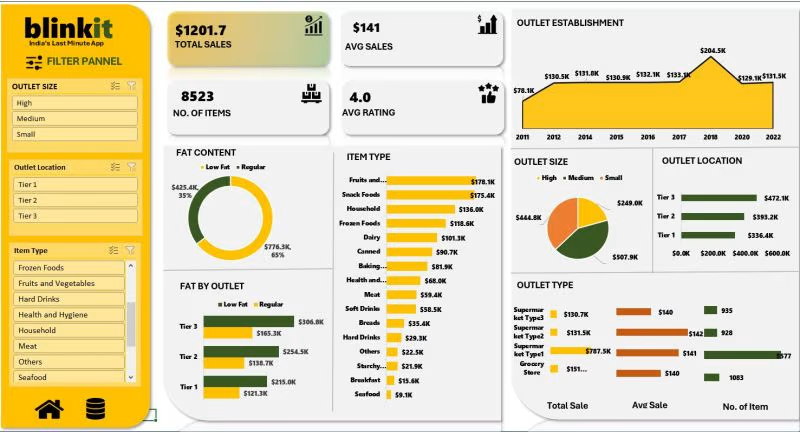
Analyzed cafe sales data to identify sales trends, popular products, revenue patterns, and key business insights. Cleaned and formatted the dataset, organized the data for analysis, and created clear visualizations to present the findings.
Tool: Microsoft Excel 2021
Project type: Personal portfolio project, not a client project.

The network for creativity
Join 1.25M professional creatives like you
Connect with clients, get discovered, and run your business 100% commission-free
Creatives on Contra have earned over $150M and we are just getting started





Related posts


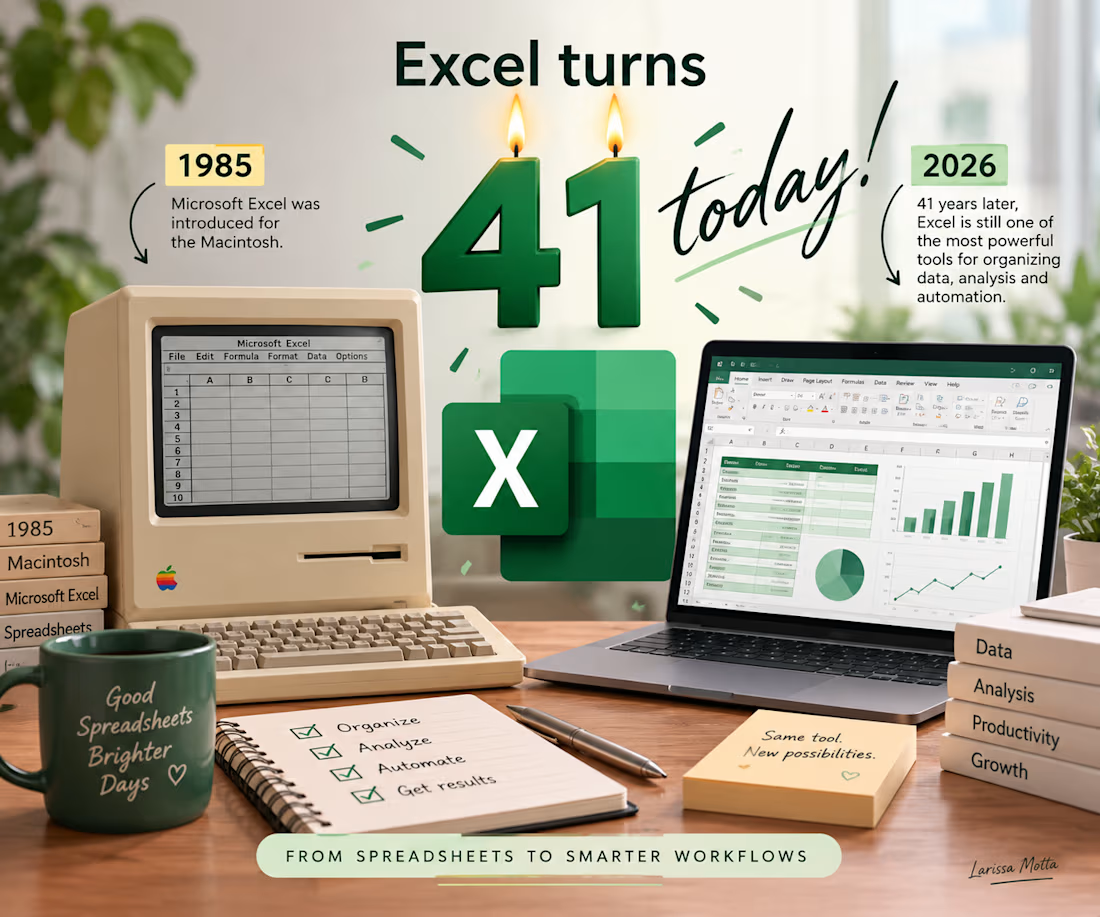
🎂 Excel turns 41 today!
On September 30, 1985, Microsoft Excel was introduced for the Macintosh.
41 years later, Excel is still one of the tools I use most in my professional work - from organizing data and financial information to creating structured spreadsheets and reports.
What started as a spreadsheet has become a powerful tool for analysis, organization, and automation.
Happy birthday, Excel! 🎂📊
And here's to many more years of spreadsheets, formulas, and probably a few #VALUE! errors along the way 😂

𝗕𝘂𝗶𝗹𝗱𝗶𝗻𝗴 𝗱𝗮𝘀𝗵𝗯𝗼𝗮𝗿𝗱𝘀 𝘁𝗵𝗮𝘁 𝗮𝗰𝘁𝘂𝗮𝗹𝗹𝘆 𝗮𝗻𝘀𝘄𝗲𝗿 𝗯𝘂𝘀𝗶𝗻𝗲𝘀𝘀 𝗾𝘂𝗲𝘀𝘁𝗶𝗼𝗻𝘀 📊
Most dashboards show you what happened.
𝗕𝘂𝘁 𝗜 𝘄𝗮𝗻𝘁𝗲𝗱 𝘁𝗵𝗶𝘀 𝗼𝗻𝗲 𝘁𝗼 𝗴𝗼 𝗮 𝘀𝘁𝗲𝗽 𝗳𝘂𝗿𝘁𝗵𝗲𝗿 𝘄𝗵𝘆 𝗱𝗶𝗱 𝗶𝘁 𝗵𝗮𝗽𝗽𝗲𝗻, 𝗮𝗻𝗱 𝘄𝗵𝗮𝘁 𝘀𝗵𝗼𝘂𝗹𝗱 𝘄𝗲 𝗱𝗼 𝗻𝗲𝘅𝘁?
📈 Sales increased by 𝟮𝟰%
📉 Profit declined by 𝟭𝟮%
📉 Margin dropped by 𝟮𝟵%
𝗔𝗳𝘁𝗲𝗿 𝗱𝗶𝗴𝗴𝗶𝗻𝗴 𝗶𝗻𝘁𝗼 𝘁𝗵𝗲 𝗱𝗮𝘁𝗮, 𝗜 𝗮𝗱𝗱𝗲𝗱 𝗮 𝗳𝗶𝗻𝗮𝗹 𝗿𝗲𝗰𝗼𝗺𝗺𝗲𝗻𝗱𝗮𝘁𝗶𝗼𝗻𝘀 𝗽𝗮𝗴𝗲:
* Cap discounts at 𝟮𝟬%
* Review 𝗹𝗼𝘀𝘀-𝗺𝗮𝗸𝗶𝗻𝗴 𝗮𝗰𝗰𝗼𝘂𝗻𝘁𝘀
* Focus on the 𝗖𝗼𝗿𝗽𝗼𝗿𝗮𝘁𝗲 𝘀𝗲𝗴𝗺𝗲𝗻𝘁
For me, a good dashboard isn’t just about making charts look nice.
It should help someone quickly understand the problem and decide what to look at next.
🎥 𝗜 𝗮𝗹𝘀𝗼 𝗿𝗲𝗰𝗼𝗿𝗱𝗲𝗱 𝗮 𝘀𝗵𝗼𝗿𝘁 𝘄𝗮𝗹𝗸𝘁𝗵𝗿𝗼𝘂𝗴𝗵 𝗼𝗳 𝘁𝗵𝗲 𝗱𝗮𝘀𝗵𝗯𝗼𝗮𝗿𝗱:
https://lnkd.in/dcfWwznc