The network for creativity
Join 1.25M professional creatives like you
Connect with clients, get discovered, and run your business 100% commission-free
Creatives on Contra have earned over $150M and we are just getting started
Back to feedPost

Prisons in Kyrgyzstan — Data Visualization
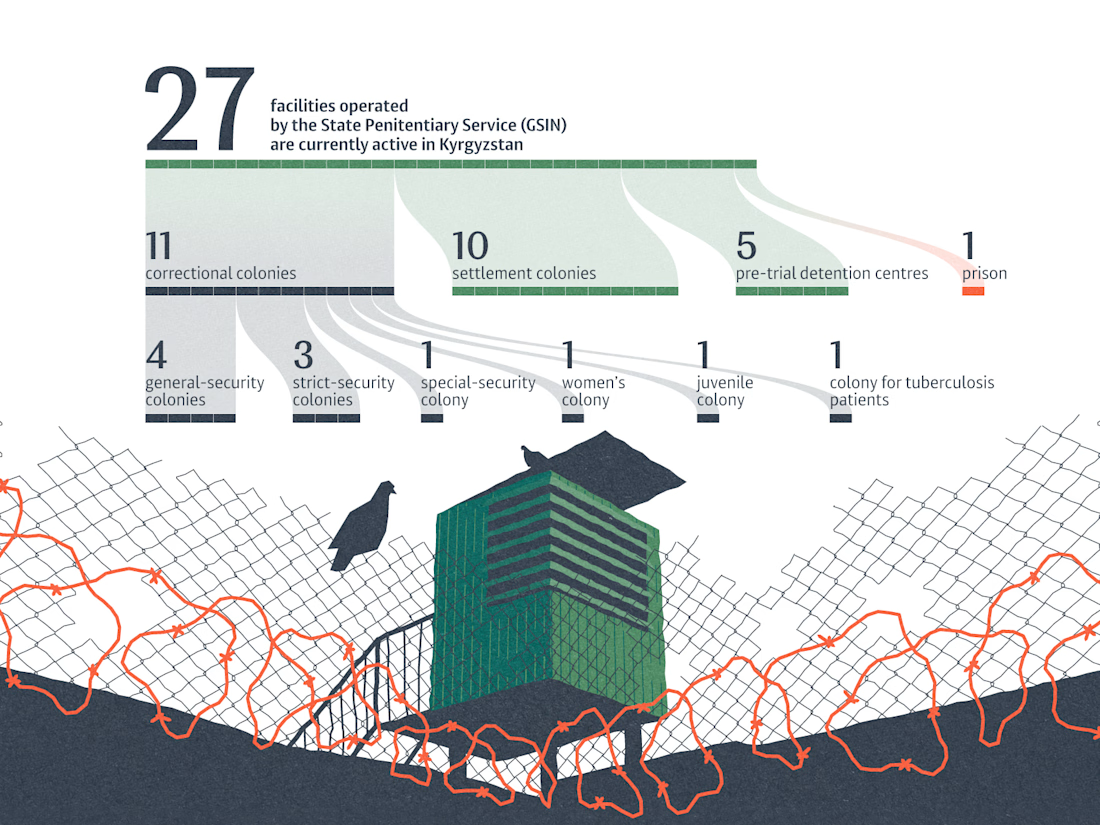
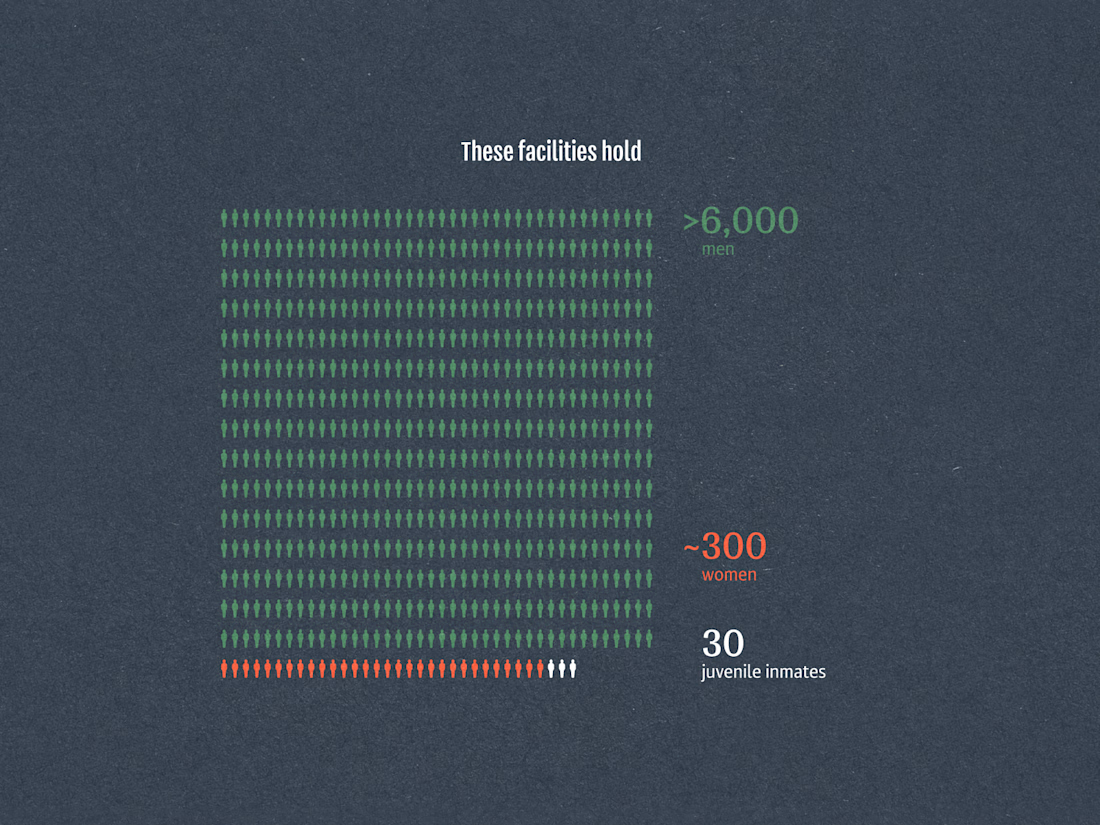
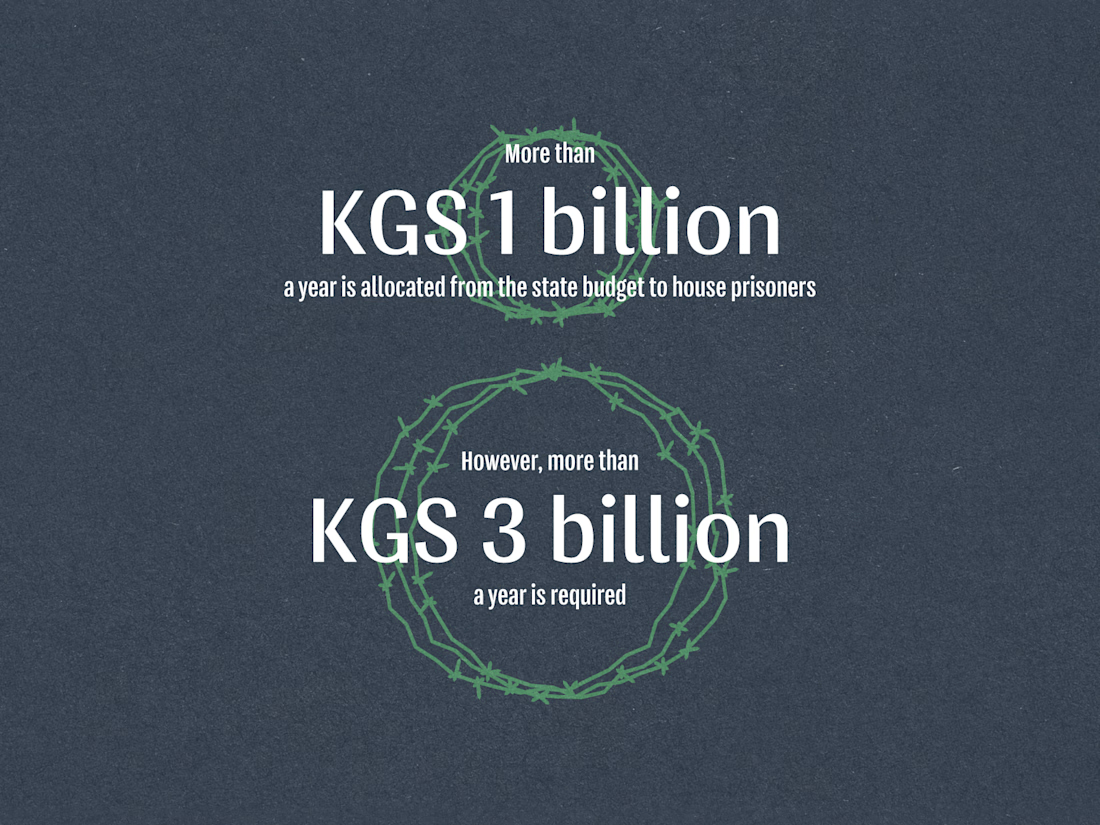
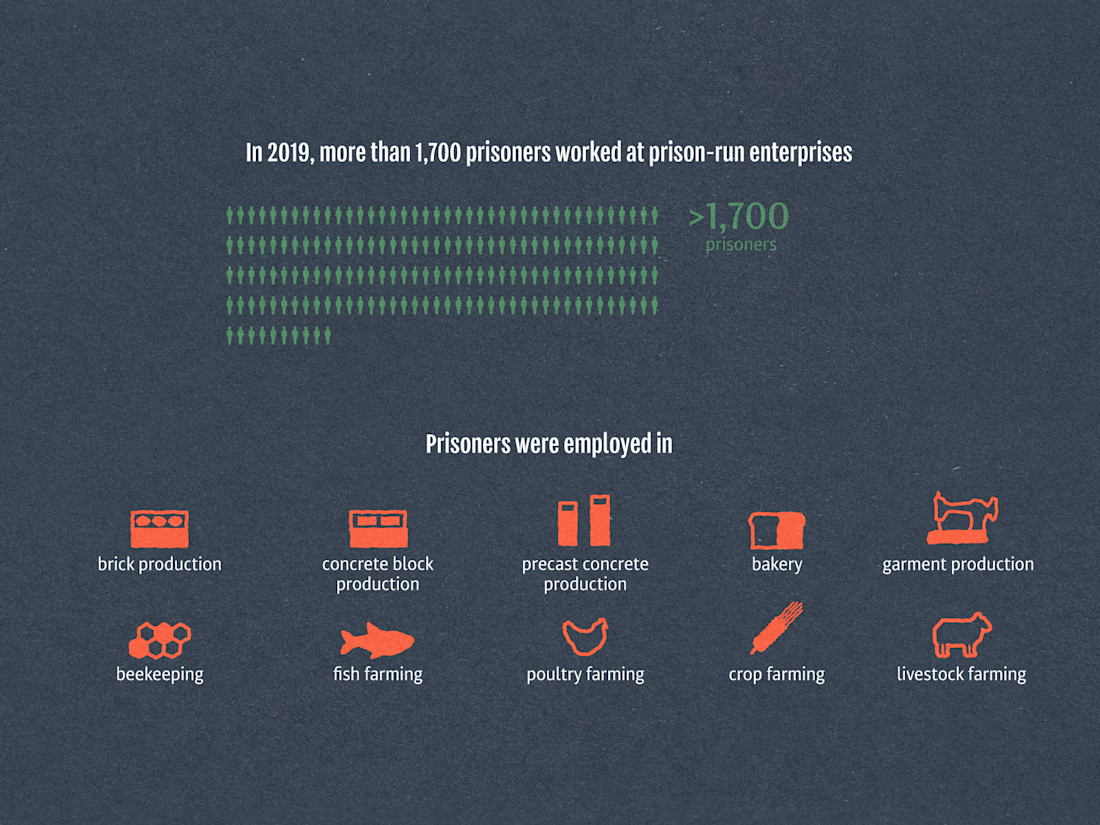
An editorial infographic exploring Kyrgyzstan’s prison system through data on correctional facilities, inmate populations, state funding, and prison labour.
The project combines pictograms, diagrammatic illustrations, and visual metaphors inspired by fences and barbed wire. A restrained colour palette and clear hierarchy help transform complex statistics into an accessible visual story.
Originally designed as a long-form vertical infographic, the project was adapted into a four-part presentation for digital platforms. The figures reflect the data available at the time of the original publication, including prison employment statistics from 2019.


The network for creativity
Join 1.25M professional creatives like you
Connect with clients, get discovered, and run your business 100% commission-free
Creatives on Contra have earned over $150M and we are just getting started
Related posts

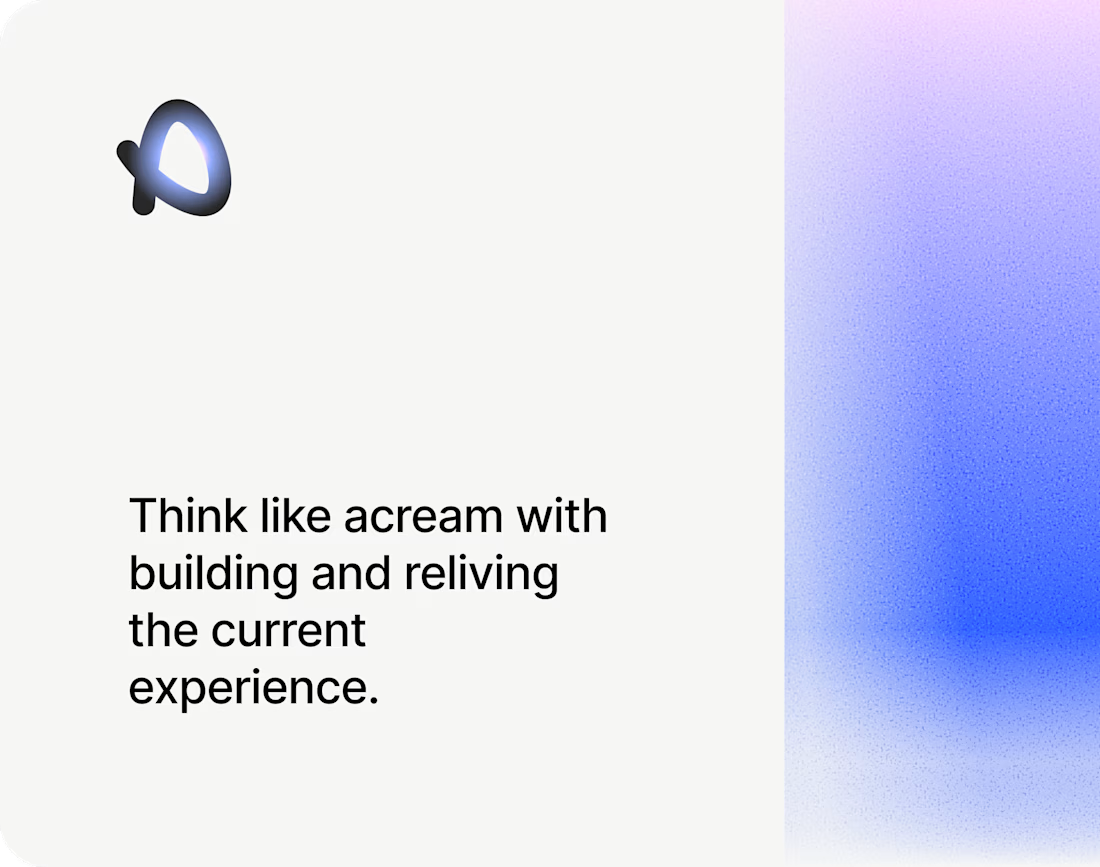

The soft blue and lilac gradient against the plain black type feels calm and a bit techy. Nice pacing in the motion too.

From static footer to motion.
It's crazy how adding motion can take something from OK to premium in an instant.


Good choice putting the motion in the footer. By the time someone scrolls that far they're already interested, so it rewards them without slowing down the first impression. For a health records app it also helps that the motion stays calm and doesn't feel flashy.

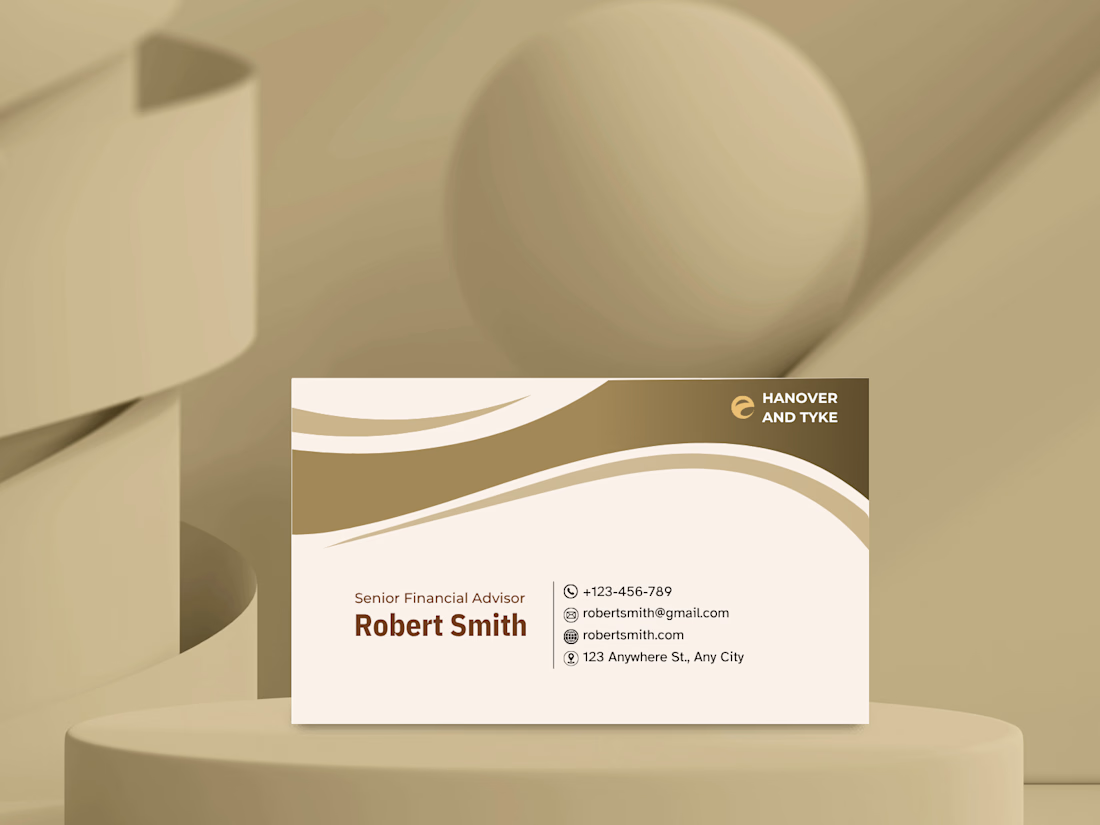
A business card concept for a financial advisory brand.
For finance, I wanted the card to feel trustworthy and calm rather than flashy. A warm gold and cream palette, flowing curves at the top to add movement, and a clean contact block with simple icons so the details are easy to scan.
Gold and cream for a finance brand: classic and trustworthy, or too soft? Tell me what you think. 👇


Masterpiece