The network for creativity
Join 1.25M professional creatives like you
Connect with clients, get discovered, and run your business 100% commission-free
Creatives on Contra have earned over $150M and we are just getting started
Back to feedPost
Chart experience for Resplendent data, a business intelligence platform

Wow, this makes analytics much easier to understand from an accountant’s perspective!
The network for creativity
Join 1.25M professional creatives like you
Connect with clients, get discovered, and run your business 100% commission-free
Creatives on Contra have earned over $150M and we are just getting started



Related posts


Onboarding workflow diagram for Resplendent Data, a B2B business intelligence platform

Business data often lives across payment, analytics, CRM, advertising, and inventory platforms. Metrik brings those signals together in one dashboard built for startups and small businesses.
See revenue, orders, customers, and business health at a glance. Compare advertising spend and ROAS across channels, explore visual KPI cards, and use smart alerts to spot unusual changes and potential risks.
The interface pairs a clean layout and rounded components with soft gradients, colorful analytics, and clear visual hierarchy, helping make business performance easier to follow.


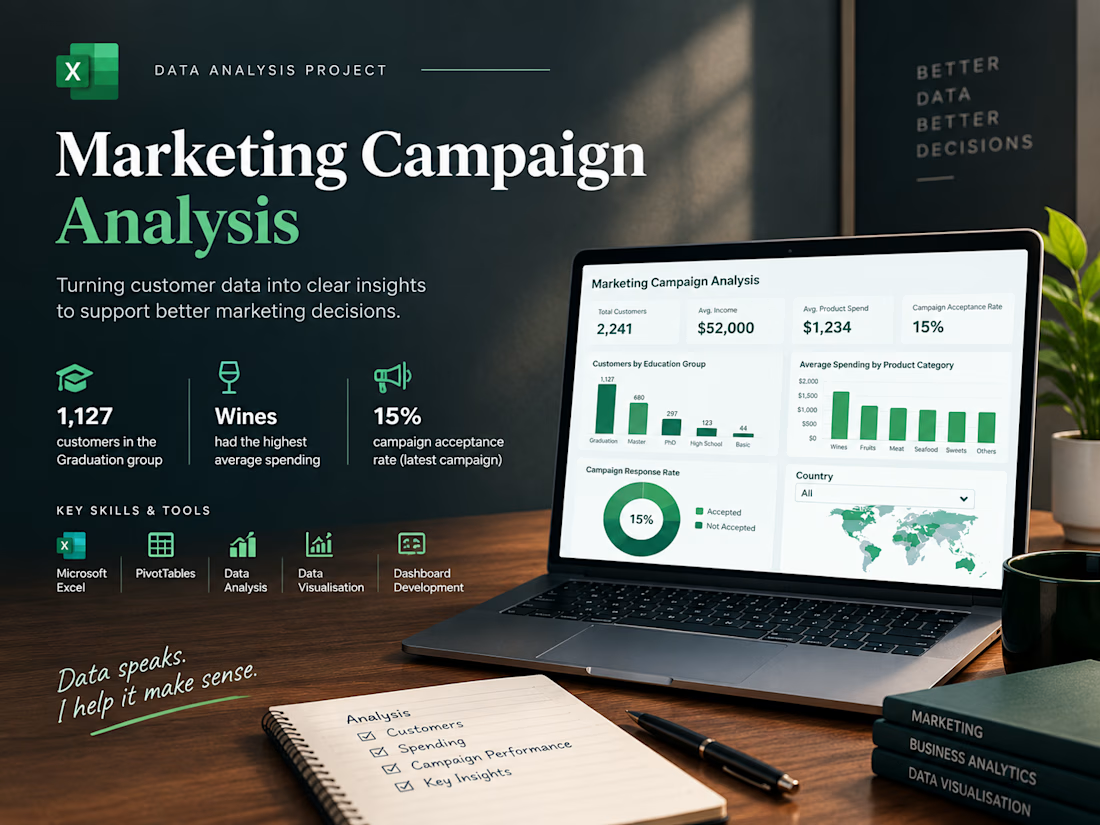
Marketing Campaign Data Analysis | Excel Dashboard & Business Insights
How well do you understand your customers, their spending habits, and the performance of your marketing campaigns?
Customer data can reveal valuable business insights, but making sense of that information requires proper analysis and clear visualization.
For this portfolio project, I worked with a marketing campaign dataset containing approximately 2,240 customer records to explore customer demographics, product spending patterns, and campaign acceptance.
What I analyzed:
📊 Customer distribution across education groups
📊 Average customer income
📊 Average spending across six product categories
📊 Marketing campaign acceptance and response rates
📊 Missing income values requiring further review
My approach:
✅ Organised and analysed customer data in Microsoft Excel
✅ Used PivotTables to summarise customer demographics and spending behaviour
✅ Created charts to compare product categories and customer groups
✅ Calculated key performance indicators (KPIs)
✅ Built an Excel dashboard with four charts and a country slicer
✅ Summarised the findings into concise, business-focused takeaways
Key findings:
🔹 Customer Demographics: Graduation was the largest education group, with 1,127 customers.
🔹 Product Spending: Wines recorded the highest average spending among the six product categories.
🔹 Campaign Performance: The latest marketing campaign achieved an acceptance rate of 15%.
Why does this analysis matter?
A well-structured dashboard helps businesses explore customer behaviour, compare spending patterns, and understand campaign results in one place.
These insights can help inform further investigation into customer segmentation and future marketing strategies.
Tools & Skills:
• Microsoft Excel
• Data Cleaning & Quality Checks
• PivotTables & Formulas
• Data Visualization
• KPI Reporting & Dashboard Development
I'm building my portfolio around practical data analysis and helping businesses turn spreadsheets into clear, useful insights.
Need help organizing your data, analyzing customer behaviour, or building an Excel dashboard? Feel free to get in touch!
#DataAnalytics #MicrosoftExcel #DataVisualization #ExcelDashboard #BusinessIntelligence #DataAnalysis