The network for creativity
Join 1.25M professional creatives like you
Connect with clients, get discovered, and run your business 100% commission-free
Creatives on Contra have earned over $150M and we are just getting started
Back to feedPost
Taste Test
Current WIP, testing two distinct Art directions for this SaaS Launch. Which one would you trust with your data? 👇

0 voted
0%

2 voted
100%

2 votes
Closed

Dark mode for the win. It has a professional gravity to it that makes me feel like my data would be in safe hands.

Thanks rana, i had a similar notion as well

Amazing work @Zeyad Salih! I would prefer dark design.
Thank you so much @Nimra . 🙏🏼
The network for creativity
Join 1.25M professional creatives like you
Connect with clients, get discovered, and run your business 100% commission-free
Creatives on Contra have earned over $150M and we are just getting started



Related posts

working on a case study for my latest project - brand identity for Coral Pay.
need your help choosing the best cover video for it:
35 voted
23%
118 voted
77%
153 votes
Closed

Lilac looks amazing with the 3D shining.

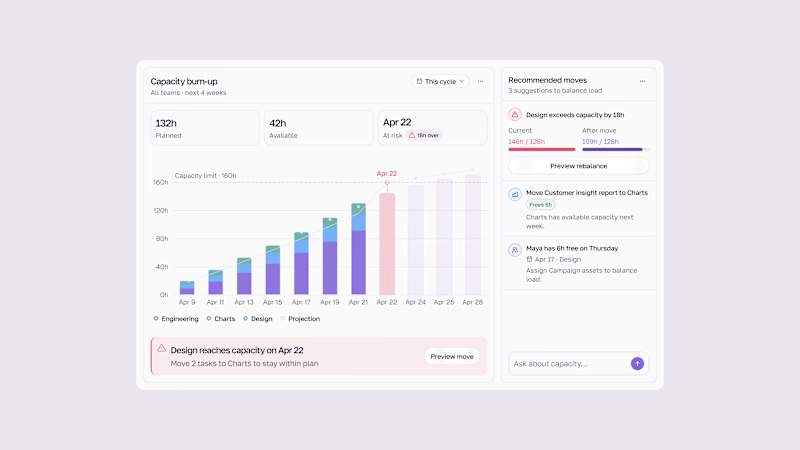
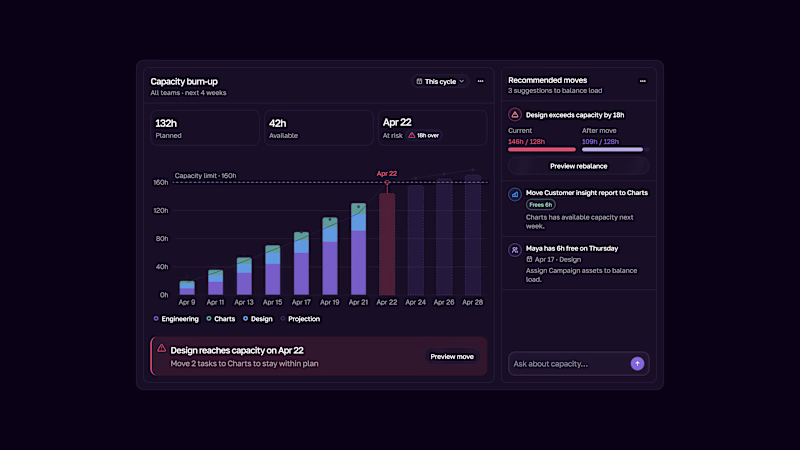
Capacity burn-up UI.
Track team workload, spot capacity risks early, and rebalance work before teams get overloaded.
Light & Dark modes.
2 voted
33%
4 voted
67%
6 votes
Closed

This is the kind of dashboard that actually gets used — the burn-up chart makes overload visible at a glance instead of hiding it in a table somewhere. I like that the point is spotting the risk early, not just reporting it after the fact. Both modes read well, though the dark one makes the chart pop a bit more for me.

From the StarlightIQ promo. Hundreds of dots, one shape, no hard cuts anywhere. Can you see the difference?
12 voted
57%
9 voted
43%
21 votes
Closed

So smooth, I really can't spot a single cut. Going with 2 on this one.