The network for creativity
Join 1.25M professional creatives like you
Connect with clients, get discovered, and run your business 100% commission-free
Creatives on Contra have earned over $150M and we are just getting started
Back to feedPost

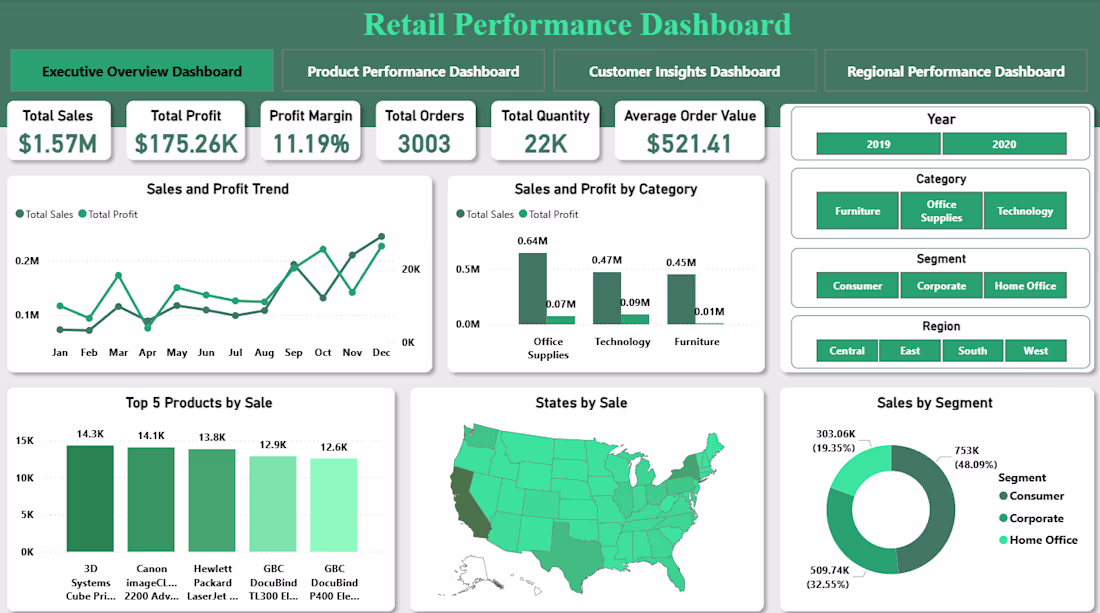
Built an interactive Retail Performance Dashboard in Power BI to analyze sales, profit, customer behavior, and regional performance. The report includes four pages: Executive Overview, Product Performance, Customer Insights, and Regional Analysis. It features KPIs, trend analysis, category comparisons, top/bottom products, customer segmentation, and geographic insights. Interactive slicers allow users to explore data by year, category, segment, and region, helping businesses make data-driven decisions and identify growth opportunities.


The network for creativity
Join 1.25M professional creatives like you
Connect with clients, get discovered, and run your business 100% commission-free
Creatives on Contra have earned over $150M and we are just getting started
Related posts

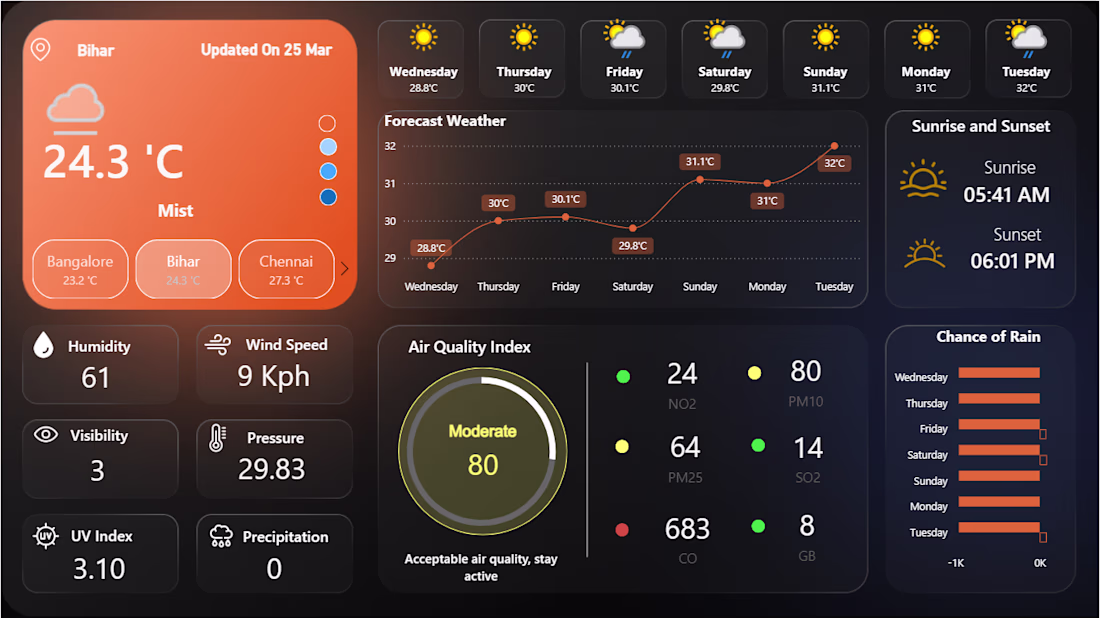
Weather Analytics Dashboard – Multi-City Monitoring (Bihar, Bangalore, Chennai, Kerala, Mumbai, Hyderabad)
This interactive weather dashboard provides a comprehensive real-time view of atmospheric and environmental conditions across major Indian cities such as Bihar, Bangalore, Chennai, Kerala, Mumbai, and Hyderabad. The interface is structured for rapid situational awareness, combining current weather metrics, forecasts, air-quality insights, and sunrise–sunset information in a single unified layout.
1. Current Weather Overview
2. Key Atmospheric Indicators
3. 7-Day Forecast Module
4. Sunrise & Sunset Timing
5. Air Quality Index (AQI) Panel
Overall Purpose
It is ideal for:
Daily weather planning
Travel and logistics
AQI awareness
Agriculture
Data-driven environmental monitoring

Profit Intelligence Dashboard | Power BI
Built an end-to-end Power BI dashboard focused on identifying profit leakage and margin inefficiencies at a product level.
This dashboard goes beyond tracking revenue and highlights where high-performing products are actually underperforming in terms of profitability.
Key Highlights:
Clear visibility into Total Sales, Profit, and Profit Margin
Identification of loss-making and underperforming products
“Revenue vs Profit” analysis to uncover hidden opportunities
Breakdown of top and lowest margin products
Actionable insights like:
High revenue ≠ high profit
Pricing and cost inefficiencies
Products driving losses despite strong sales
Impact:
Helps businesses shift focus from just revenue to profit-driven decision making, enabling better pricing, cost control, and product strategy.
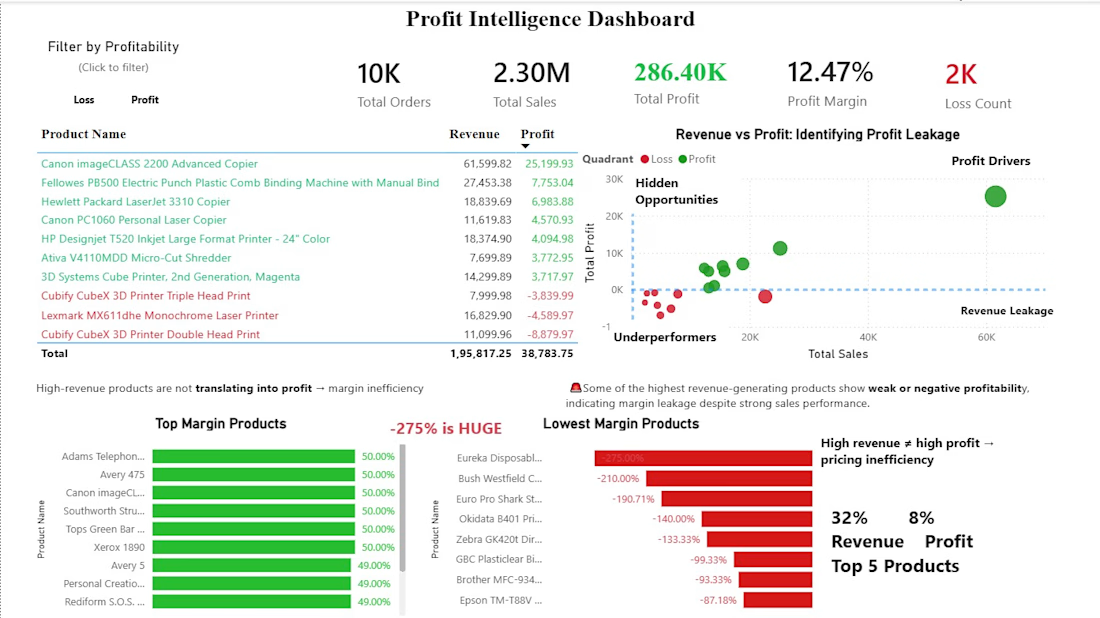

The Revenue vs Profit quadrant chart is the standout feature here — separating hidden opportunities from underperformers and profit drivers in one visual makes margin analysis instantly actionable. The insight that -275% margin exists despite strong sales volume is exactly the...


Looks awesome!


Trending


Figma Make
Go from idea to prototype in minutes. What are you designing?
brandguidelines
Brand guidelines are becoming living systems, not static documents. What are you building for your clients?
aivideo
AI video tools are moving at warp speed. Which ones are you experimenting with?
illustration
Handcrafted illustration is bubbling up across the web. What are you drawing lately?
freelancerlife
Freelancer life is wins, pivots, and everything in between. What’s yours right now?