The network for creativity
Join 1.25M professional creatives like you
Connect with clients, get discovered, and run your business 100% commission-free
Creatives on Contra have earned over $150M and we are just getting started
Back to feedPost

I created this animated infographic to explain my process for designing clear, easy-to-follow infographics.
I first identify the main idea and understand the audience to make the information easy to digest.
Then I organize the information, build a clear visual hierarchy, and choose visuals that help explain the message.
From layout and typography to spacing, details, and animation, each element has a purpose. The final step is to bring everything together in a format that feels engaging and easy to follow.
This project is a reflection of how I approach visual design and communication now.
Complex information easier to understand, one step at a time.



The network for creativity
Join 1.25M professional creatives like you
Connect with clients, get discovered, and run your business 100% commission-free
Creatives on Contra have earned over $150M and we are just getting started







Related posts


Visual identity revision for a psychology and management consulting firm


handsome works! anyway did you use any ai to generate mockups on that? or you did manual


Check it out
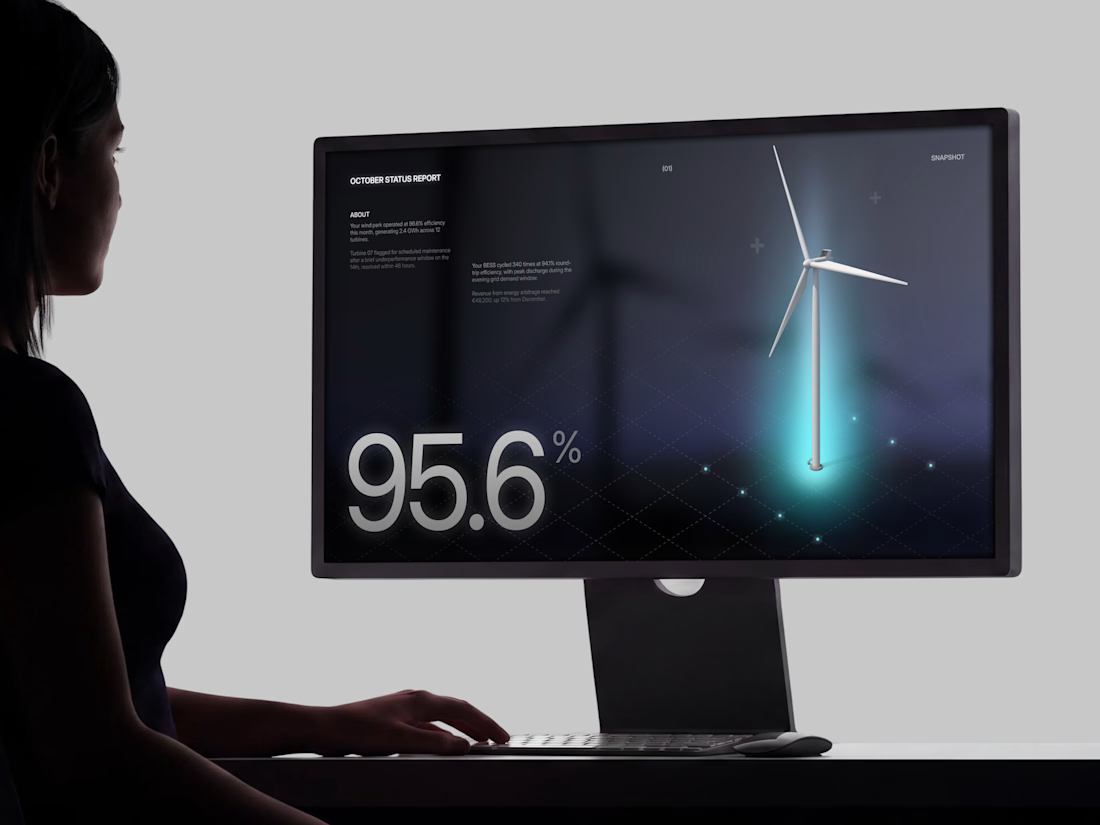
Just published: 0-1 design for an Energy Management System (EMS) ⚡
Designed a desktop platform monitoring wind turbines, PV parks, and battery storage across multiple sites. Keeping the interface mostly white, so green and red status indicators do the talking.
Operators managing critical infrastructure need to assess system health instantly. No visual noise, no cognitive overload. Just unmistakable state communication.


Cool work 👌

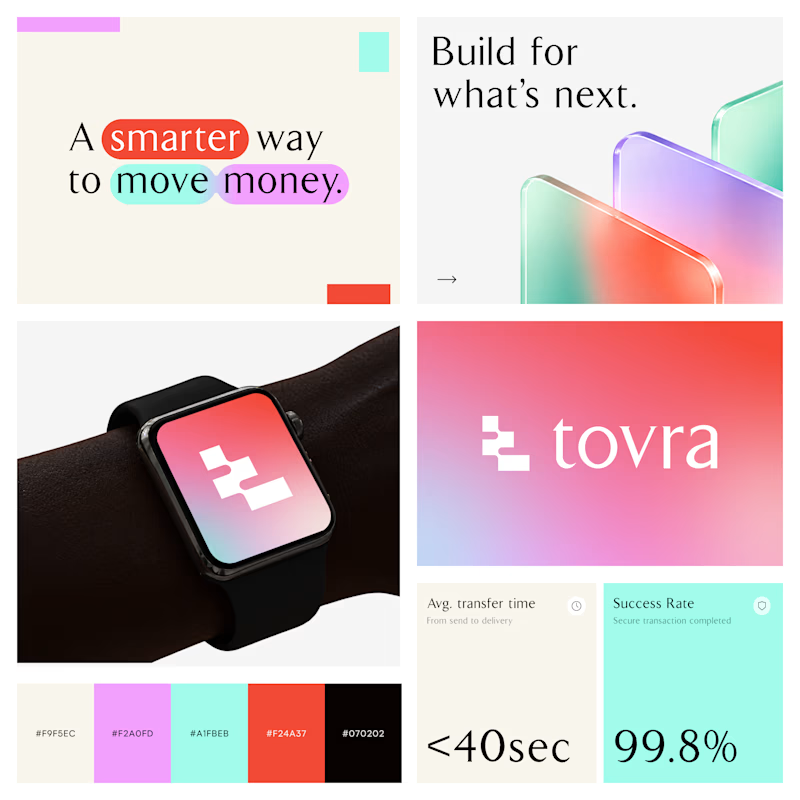
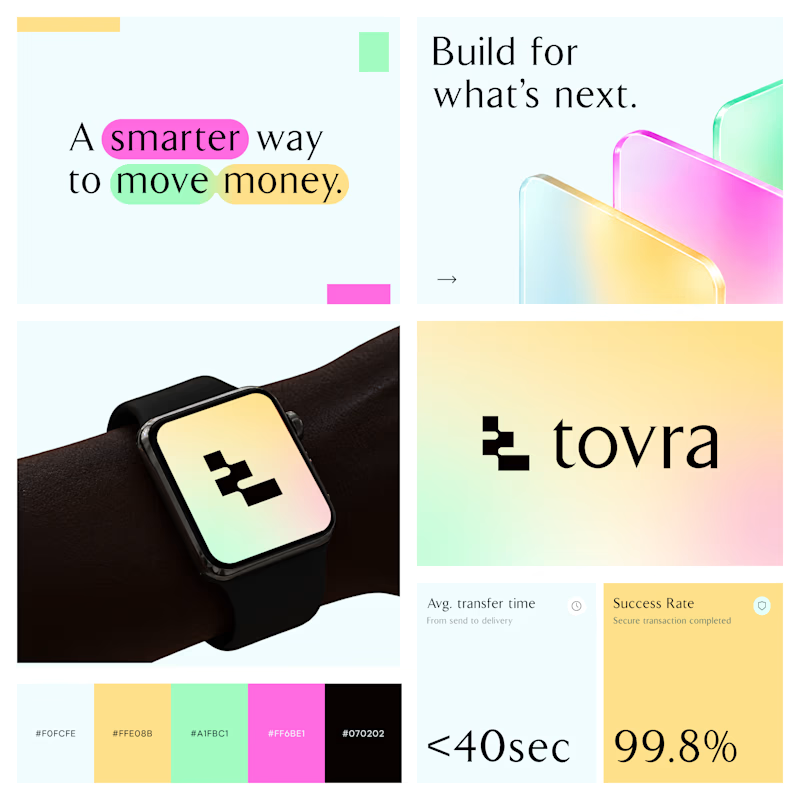
Two Color Directions. One Brand Identity.
Exploring two visual directions for Toyra, a modern fintech brand focused on making money movement smarter and simpler.
Both concepts feature bold typography, vibrant colors, playful gradients, and a clean visual identity.
Which color direction works better for Brand Option A or Option B? 👀
19 voted
40%
29 voted
60%
48 votes
Closed