The network for creativity
Join 1.25M professional creatives like you
Connect with clients, get discovered, and run your business 100% commission-free
Creatives on Contra have earned over $150M and we are just getting started
Back to feedPost

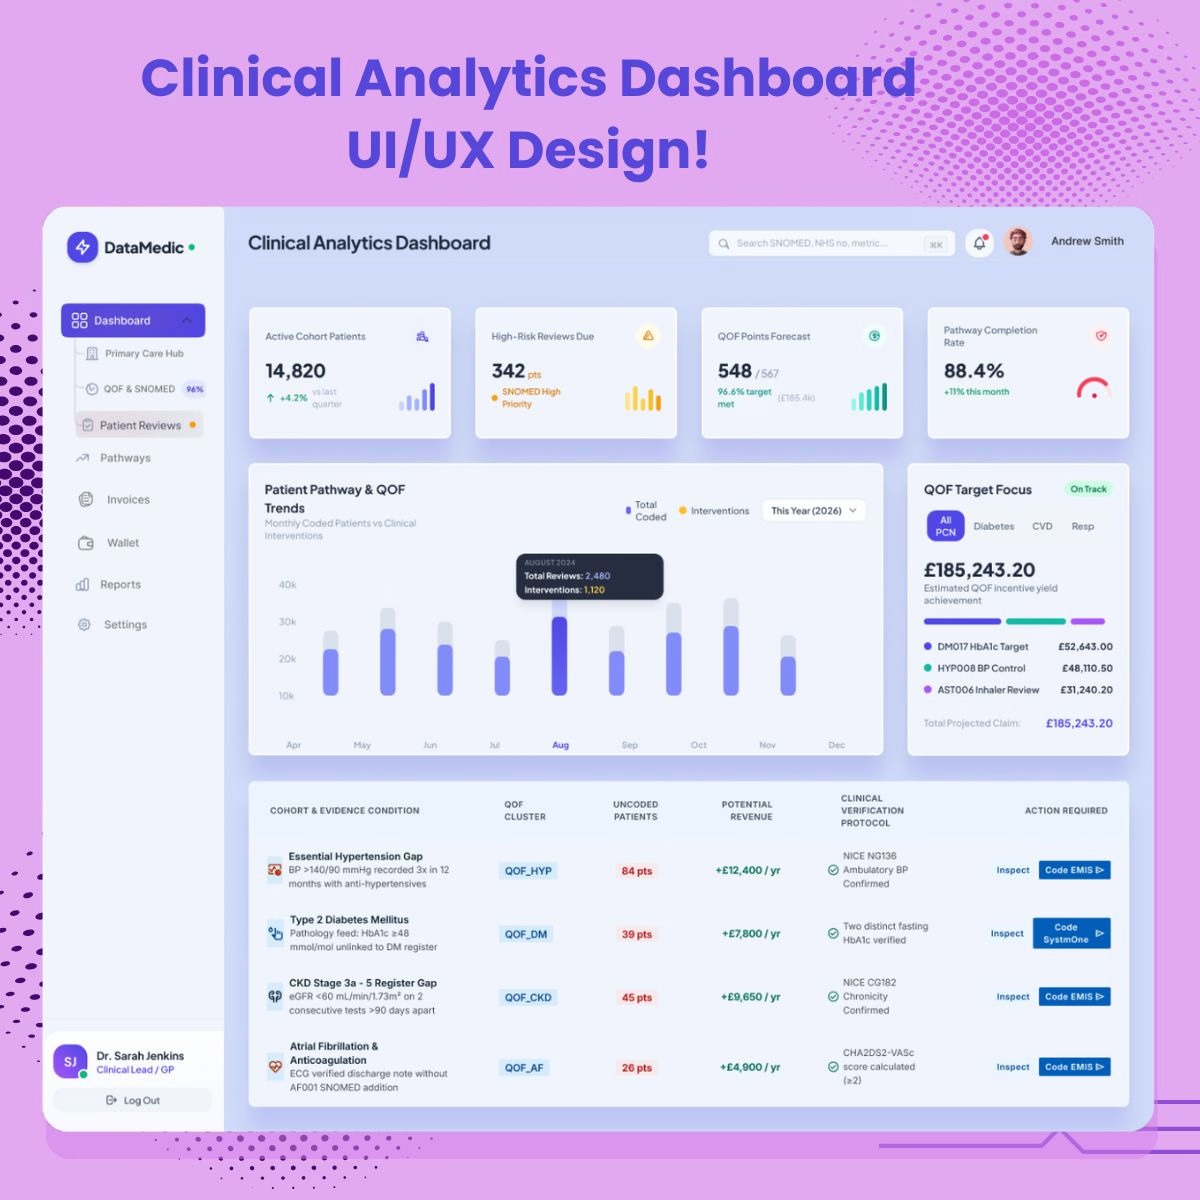
🚀 Introducing My Clinical Analytics Dashboard UI/UX Design!
I’m excited to share my latest UI/UX design project — a Clinical Analytics Dashboard, designed in Figma. 🏥📊
The goal of this project was to create a clean, modern, and user-friendly dashboard that helps healthcare professionals visualize clinical data, monitor key metrics, and make data-driven decisions more efficiently.
✨ Key Design Highlights:
🔹 Clean and intuitive user interface
🔹 Data visualization and analytics
🔹 Organized dashboard layout
🔹 User-centered design approach
🔹 Modern and consistent visual hierarchy
Through this project, I focused on combining functionality with aesthetics to deliver a seamless user experience for healthcare analytics.
I’m always passionate about creating meaningful digital experiences that solve real-world problems through thoughtful UI/UX design.
💬 What do you think of this dashboard design? I’d love to hear your feedback!
#UIUXDesign #Figma #DashboardDesign #ClinicalAnalytics #HealthcareUX #ProductDesign #UIDesign #UXDesign

The network for creativity
Join 1.25M professional creatives like you
Connect with clients, get discovered, and run your business 100% commission-free
Creatives on Contra have earned over $150M and we are just getting started



Related posts

Photographer Portfolio Website
"Capturing light, emotion, and the moments you never want to forget." That line set the tone, and the layout follows it.
The hero is one motion-blurred portrait washed in red. The photographer's name runs across the bottom in a condensed white face, so large the screen cuts it off. The photo keeps its soft focus, and the name still reads first.
Thin grid lines split the page into narrow columns, and the small copy sits justified inside them. The loose photo gets a strict structure to lean on.
A single round red button with an arrow sits right on the letters and marks where to go next.
Designed by the Hue & Machine team.
#WebDesign #Photography #PortfolioWebsite #EditorialDesign #Typography #UIDesign #ProductDesign #CreativeDirection #ResponsiveDesign #FigmaDesign


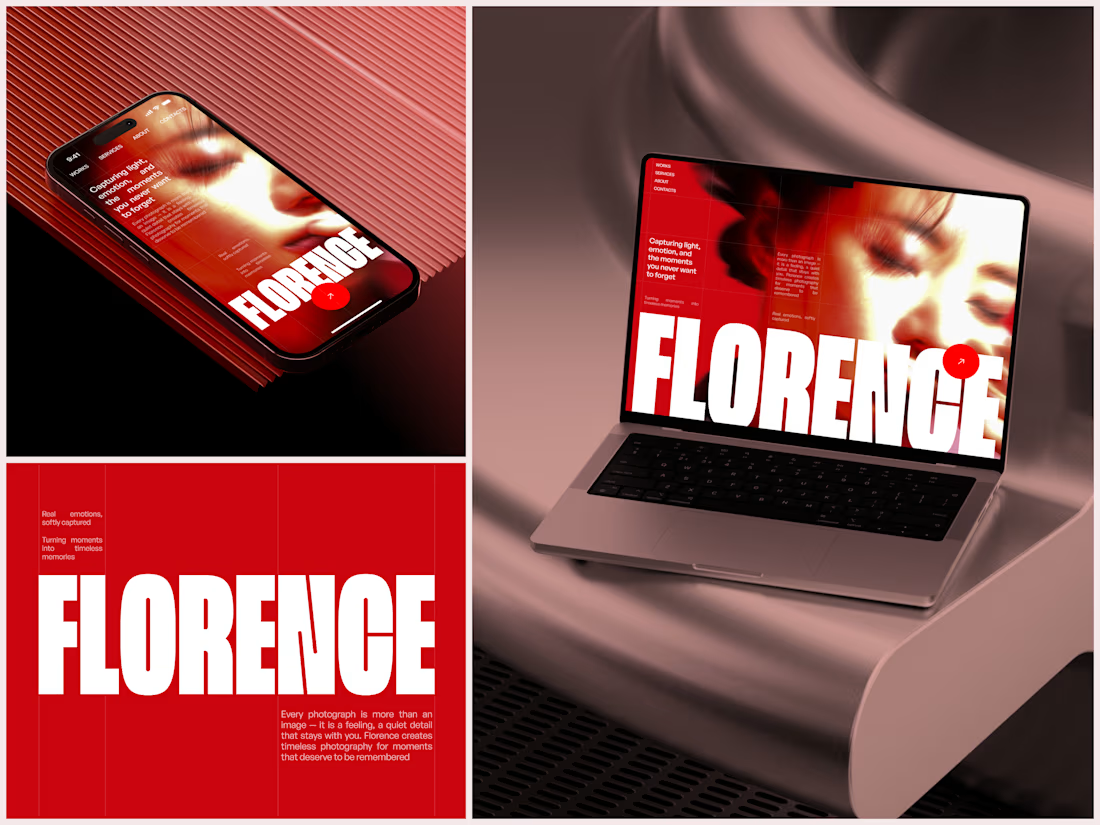

The heavy condensed white FLORENCE over the red portrait is bold, and keeping the same red across phone, laptop and type tile makes the case study read as one system. Did the red come from the photographer's own work, or was it your call?


Rebuilt my portfolio with AI and added new case studies.
Brand, web, and product UI. All custom coded, all in one page.

One page with brand, web and product UI together is a strong move. Clients see the range without clicking around. Rebuilding mine with AI coding tools taught me the same thing: the speed lets you spend the saved time on the case study writing, which is what actually wins work.