The network for creativity
Join 1.25M professional creatives like you
Connect with clients, get discovered, and run your business 100% commission-free
Creatives on Contra have earned over $150M and we are just getting started
Back to feedPost
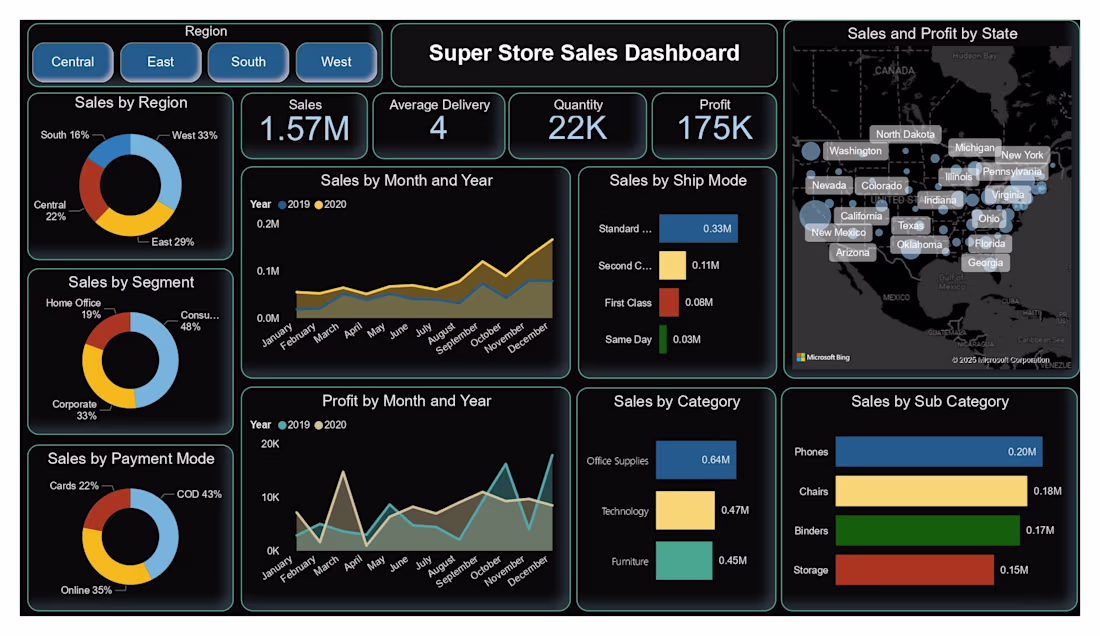
Sales Performance Dashboard & Analysis
Project Type: Data Analysis · Business Intelligence · Sales Optimization
Overview
Developed an interactive sales dashboard to track and analyze multi-state performance, regional trends, and category-level revenue enabling data-driven sales strategy and resource allocation.
Key Insights & Deliverables
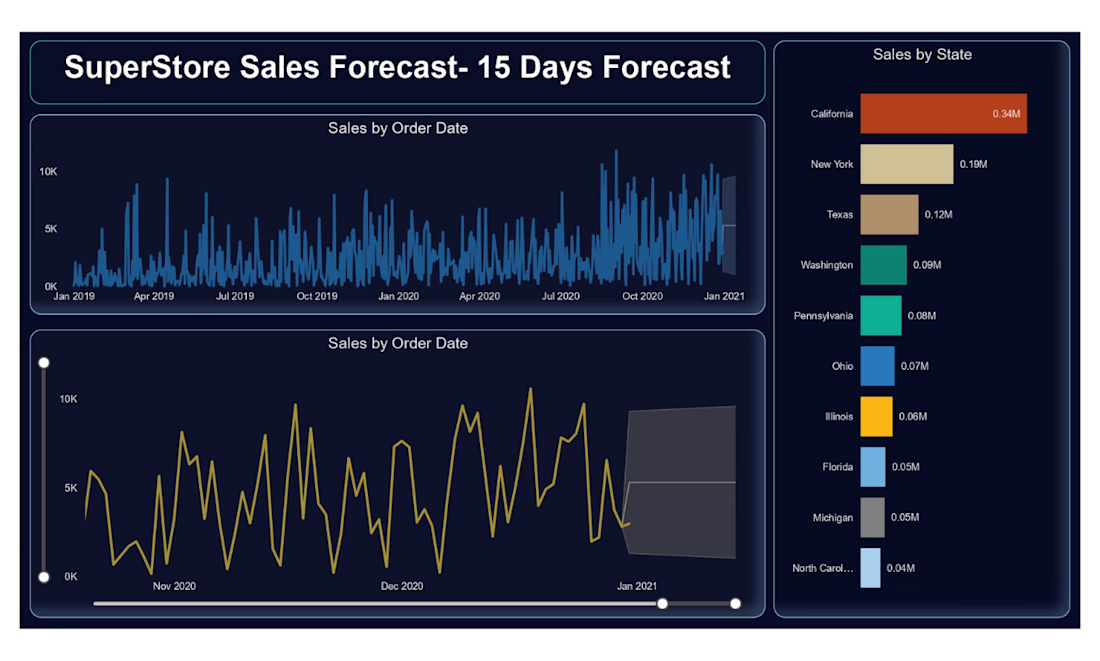
◼ Top-performing state: California ($0.34M), followed by New York and Texas.
◼ Regional balance: East and West each accounted for 33% of total sales.
◼ Best segment: Consumer sales led at 48%, outperforming Corporate and Home Office.
◼ Preferred payment: Cash on Delivery (43%) surpassed card payments.
Tools: Power BI · Data Visualization · Sales Analytics · Business Reporting
#PowerBI #SalesDashboard #DataVisualization #BusinessIntelligence #SalesAnalysis #DataAnalytics #DashboardDesign
The network for creativity
Join 1.25M professional creatives like you
Connect with clients, get discovered, and run your business 100% commission-free
Creatives on Contra have earned over $150M and we are just getting started
Related posts
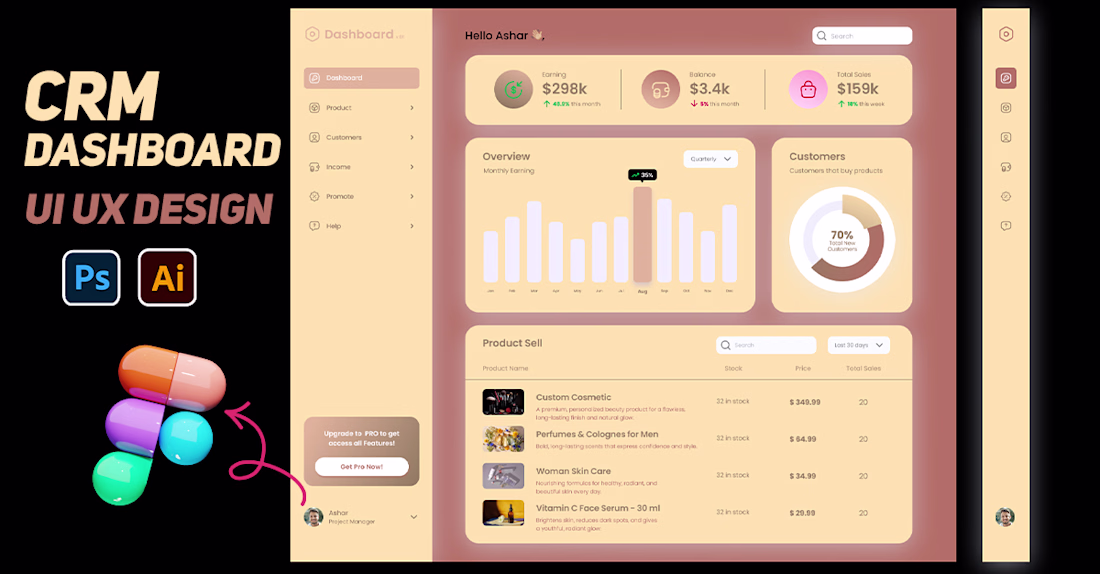
Product CRM Dashboard Website UI UX Design
Great
Designed and developed an interactive Power BI dashboard to analyze sales performance, revenue, profit, customer trends, and regional insights. The dashboard includes KPI cards, interactive filters, slicers, charts, and drill-down functionality to help businesses make data-driven decisions. The project involved data cleaning, transformation using Power Query, DAX calculations, and professional dashboard design.
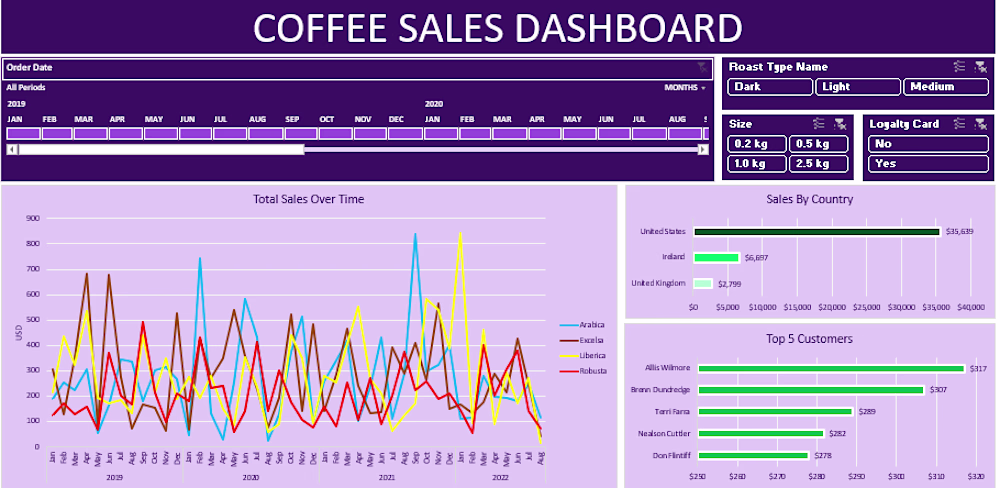
Developed a dynamic Coffee Sales Dashboard in Microsoft Excel to analyze sales performance across products, countries, customer segments, and time periods. The dashboard features interactive slicers, sales trend analysis, top customer insights, country-wise sales comparisons, roast type analysis, loyalty card segmentation, and product size filters. Built using Pivot Tables, Pivot Charts, Slicers, Lookup Functions, and advanced Excel features, this project provides meaningful business insights through professional and interactive reporting.
Trending
Claude
Claude has entered the design space. How are you using Claude Design?
Contra University
Learn from expert creatives how to earn more using next-gen AI tools.
fifaworldcup2026
The World Cup is here and the whole world's watching. How are you designing for the world stage?
creativeaiflow
Creative AI workflows are evolving. What tools do you use, and what are their strengths and weaknesses?
freelancerlife
Freelancer life is wins, pivots, and everything in between. What’s yours right now?