The network for creativity
Join 1.25M professional creatives like you
Connect with clients, get discovered, and run your business 100% commission-free
Creatives on Contra have earned over $150M and we are just getting started
Back to feedPost

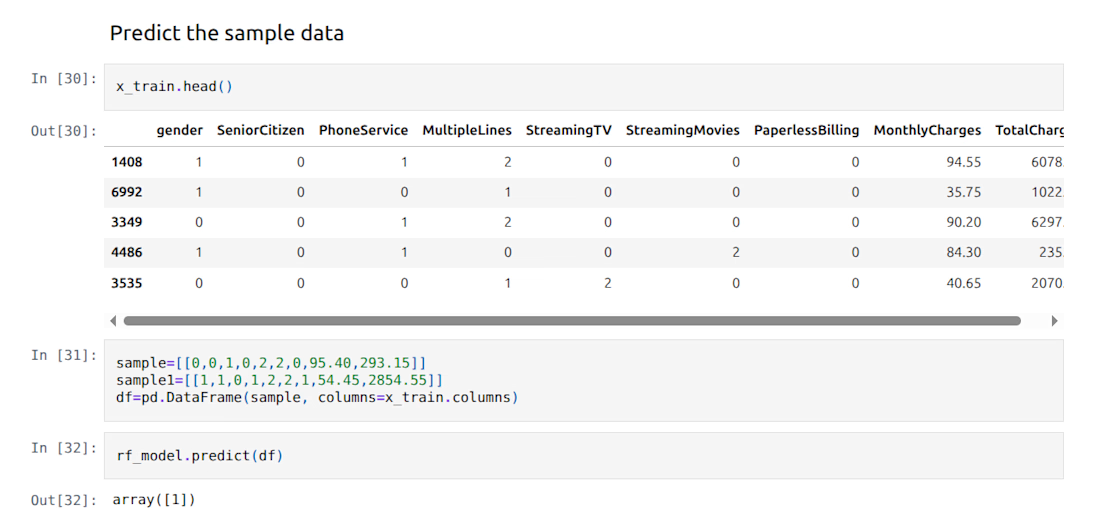
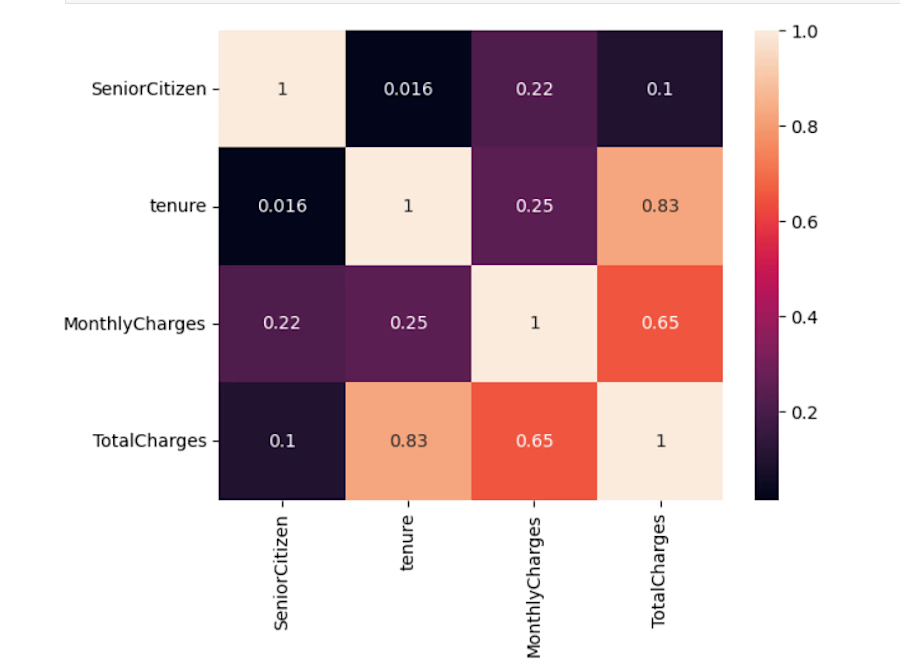
Telecom Customer Churn Prediction using Machine Learning
Exploratory data analysis and sample prediction output from a machine learning model designed to identify high-risk telecom customers.
The network for creativity
Join 1.25M professional creatives like you
Connect with clients, get discovered, and run your business 100% commission-free
Creatives on Contra have earned over $150M and we are just getting started





Related posts

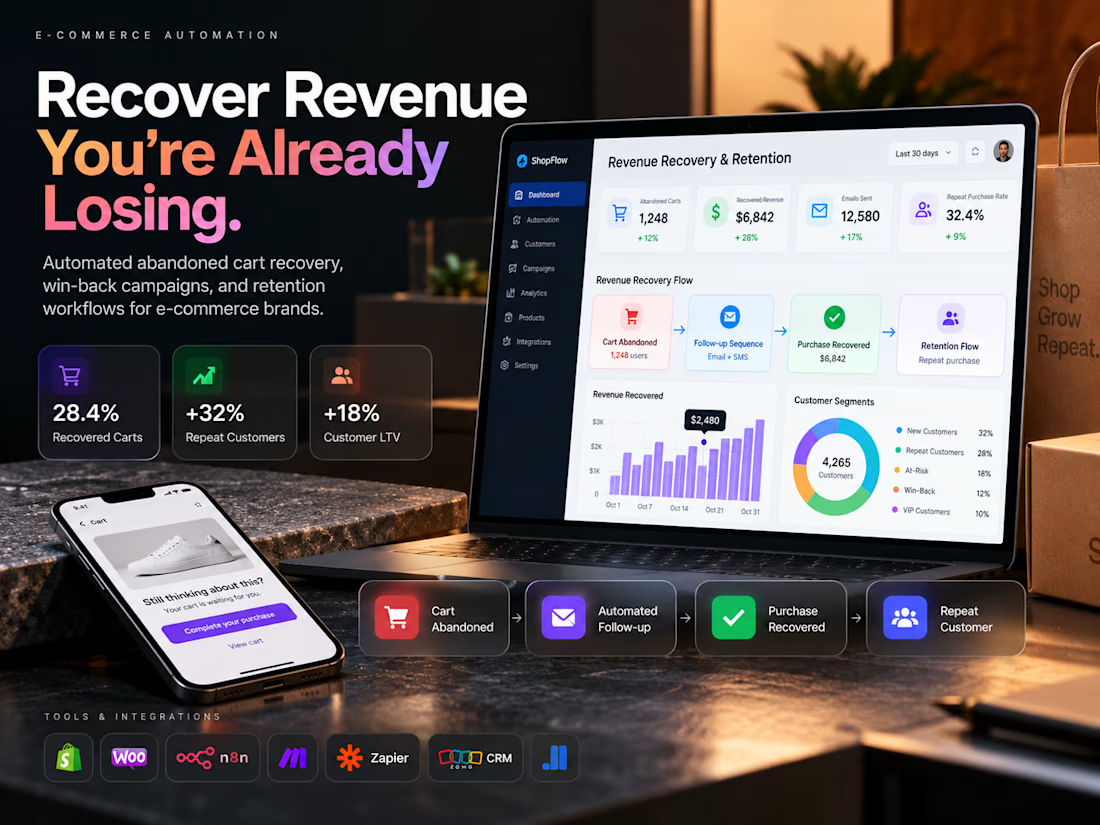
E-commerce Revenue Recovery & Retention Automation System
I designed an e-commerce revenue recovery and retention system to show how online stores can recover abandoned sales and bring more customers back to purchase again.
The system automates key customer journeys including abandoned-cart recovery, post-purchase follow-up, win-back campaigns, repeat-purchase reminders, and customer segmentation.
Instead of relying on manual follow-ups, the workflow uses customer behavior and purchase data to trigger the right action at the right time.
The system follows a simple journey:
Customer Visits → Adds to Cart → Abandons → Automated Follow-up → Purchase → Retention Workflow → Repeat Purchase
I also structured the system to track how customers move through each stage, so the business can see where revenue is being recovered and where customers are dropping off.
The project demonstrates how automation can help an e-commerce brand:
Recover lost sales • Increase repeat purchases • Improve retention • Reduce manual follow-up • Increase customer lifetime value
Tools & technologies: Shopify, Klaviyo/Zoho Marketing Automation, n8n, Make, Zapier, CRM systems, email/SMS automation, and customer-data workflows.



What caught my attention was the stage by stage tracking you built, it should pinpoint exactly where the drop offs happen and where the recovered revenue comes from

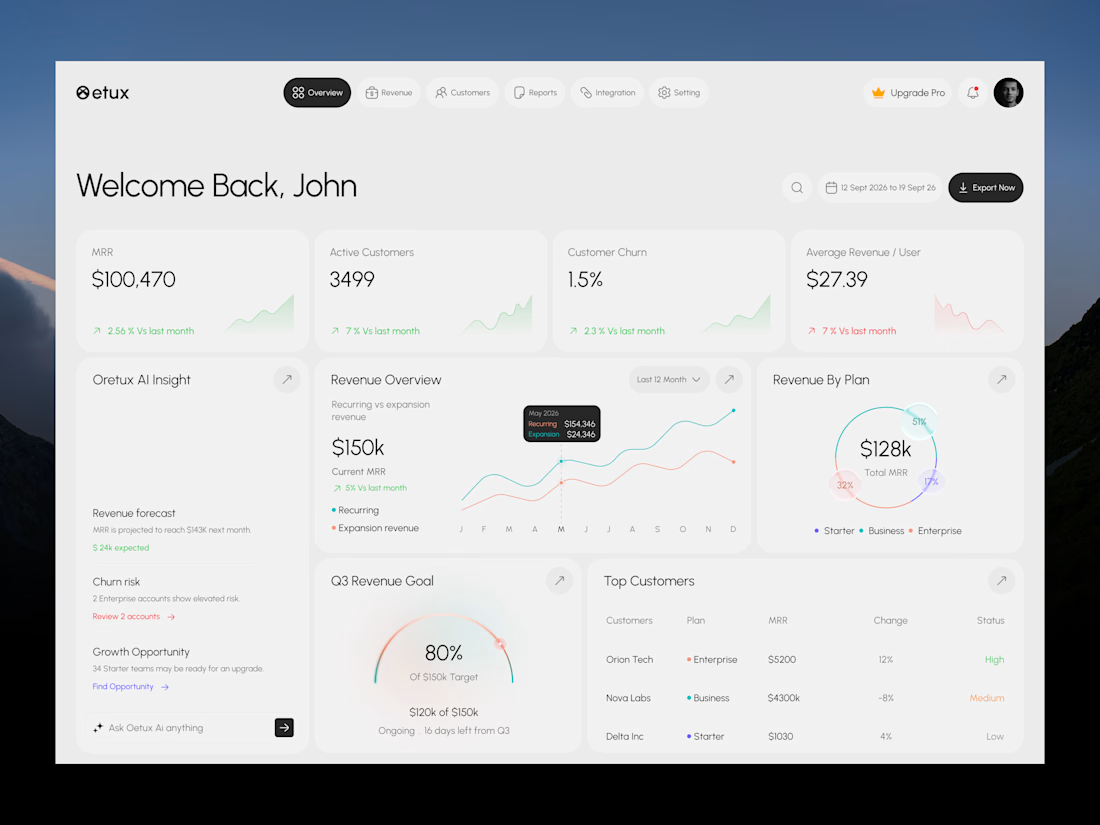
Oetux – SaaS Revenue Analytics Dashboard
The client had a lot of data, but the real problem was making sense of it.
MRR, revenue, churn, active customers, growth, customer performance, goals. Every metric was important, but when everything gets the same attention, users don’t know where to look first.
The existing experience made users spend too much time switching between information and trying to connect the numbers.
So we focused on how SaaS teams actually read their business data. We structured Oetux around the questions that matter most.
How is revenue performing?
Are we growing?
Are customers staying?
Where are we losing revenue?
What needs attention right now?
Then we organized KPIs, revenue trends, customer performance, churn insights, goals, and AI powered insights into one clear experience.
The goal wasn’t to remove data.
It was to organize the data so users could understand it faster.
That’s what we solved with Oetux.
Turning a data heavy SaaS dashboard into an experience that helps teams see their business clearly and make better decisions.



Love the clean layout.

Case study on 100K+ real e-commerce orders (Olist dataset): why did revenue growth stop? I built a 6-page Power BI diagnostic star schema, 25+ DAX measures (revenue decomposition into volume vs. basket effects, MoM/YoY, CROSSFILTER) plus a plain-English executive report with a 30/60/90 action plan. Key findings: orders flatlined at 6.6K/month; 97% of buyers never return; one region carries 38.4% of revenue; one category hides a 15.7% decline. Full pipeline on GitHub: Python ETL, SQL validation, dashboard, report.


