The network for creativity
Join 1.25M professional creatives like you
Connect with clients, get discovered, and run your business 100% commission-free
Creatives on Contra have earned over $150M and we are just getting started


The network for creativity
Join 1.25M professional creatives like you
Connect with clients, get discovered, and run your business 100% commission-free
Creatives on Contra have earned over $150M and we are just getting started



Related posts

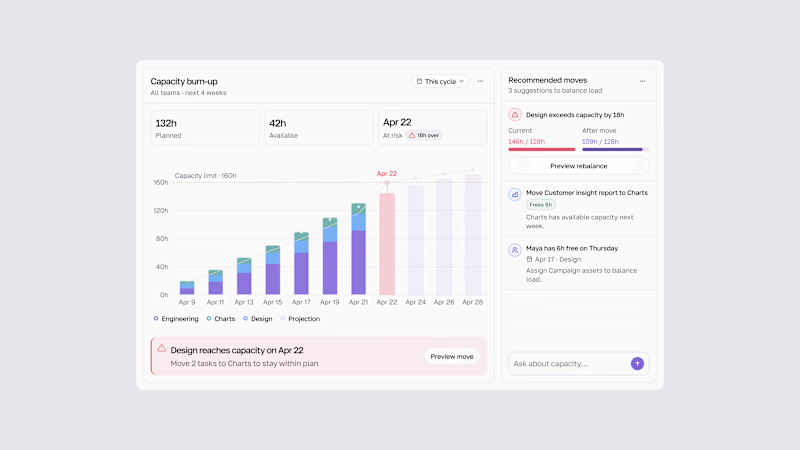
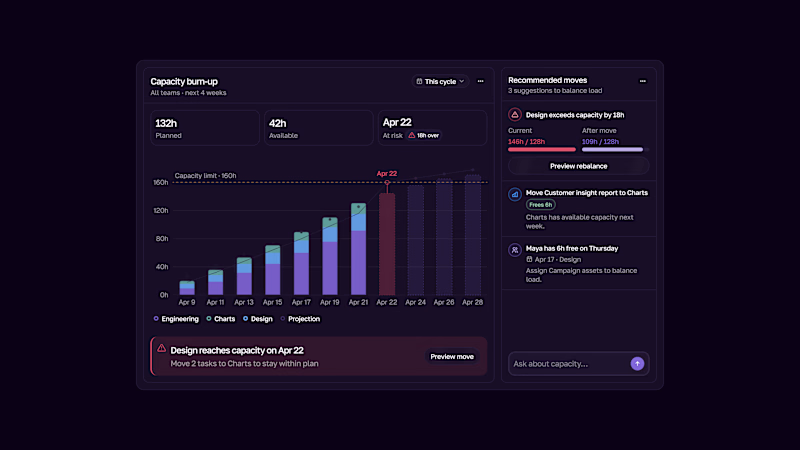
Capacity burn-up UI.
Track team workload, spot capacity risks early, and rebalance work before teams get overloaded.
Light & Dark modes.

2 voted
33%
4 voted
67%
6 votes
Closed

This is the kind of dashboard that actually gets used — the burn-up chart makes overload visible at a glance instead of hiding it in a table somewhere. I like that the point is spotting the risk early, not just reporting it after the fact. Both modes read well, though the dark one makes the chart pop a bit more for me.


Love the live bento idea.

Aside from the bugs every other thing is up and working more updates to come this week.