The network for creativity
Join 1.25M professional creatives like you
Connect with clients, get discovered, and run your business 100% commission-free
Creatives on Contra have earned over $150M and we are just getting started
Back to feedPost

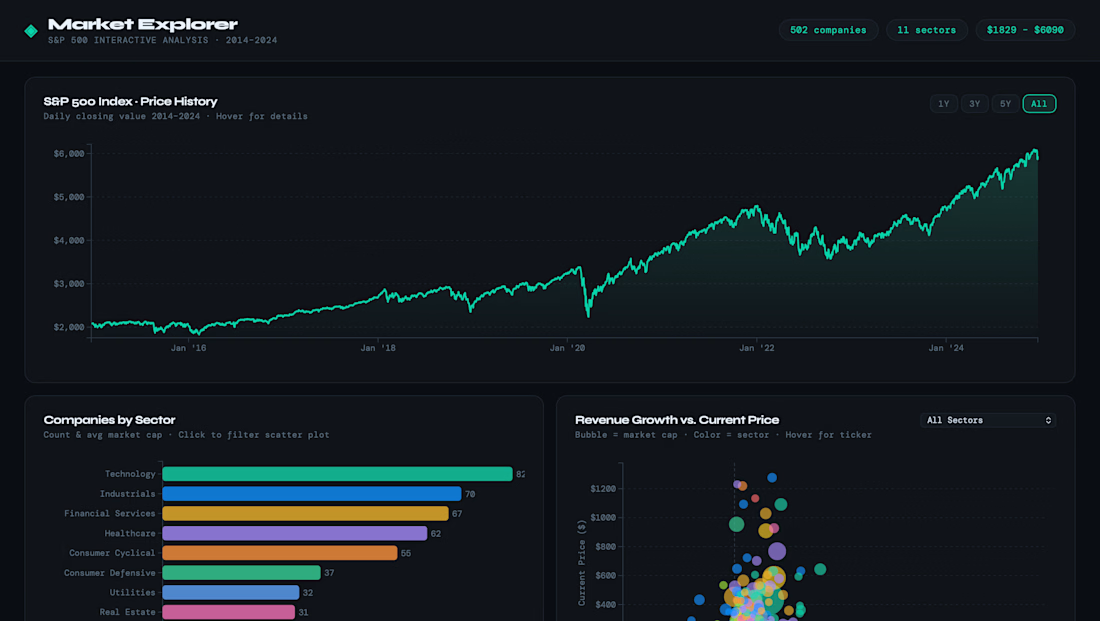
An interactive D3.js dashboard exploring 502 S&P 500 companies across 11 sectors, with 10 years of index price history. Four linked, coordinated views (line chart, sector breakdown, market cap ranking, and a growth-vs-price scatter plot) let users cross-filter by sector and drill into individual companies. Key findings: Technology dominates the index with 82 companies, nearly 4x Energy or Basic Materials, and just three companies (AAPL, NVDA, MSFT) represent roughly $10.3T in market cap, more than several entire sectors combined.


The network for creativity
Join 1.25M professional creatives like you
Connect with clients, get discovered, and run your business 100% commission-free
Creatives on Contra have earned over $150M and we are just getting started
Trending

Claude
Claude has entered the design space. How are you using it?

Contra University
Learn from expert creatives how to earn more using next-gen AI tools.
Brand Design
The best brand designers are on Contra. Scroll to see what's trending in brand design. What are you building?
creativeaiflow
Creative AI workflows are evolving. What tools do you use, and what are their strengths and weaknesses?
freelancerlife
Freelancer life is wins, pivots, and everything in between. What’s yours right now?
Related posts


Brilliant Work

Spent the weekend cleaning out my camera roll. Somewhere in there I noticed something I'd swiped past a thousand times, that subtle parallax shift when you move between photos.
So I rebuilt it for the web.
- Spring physics, no animation library
- Rubber band effect at the edges
- Full keyboard navigation
- Screen reader support
Didn't want to just leave it as a demo. If you can't use a mouse, it still works. If you can't see it, it tells you what photo you're on.


Love that you didn't stop at making it look good. Accessibility is what makes it complete.

Live GitHub Pulse — Broadcast Ticker for the Rive Broadcast & Livestream UI Challenge
I work as a data analyst and dashboard specialist, so when I saw this challenge, I didn't want to just animate something pretty — I wanted to see if I could bring actual live-data thinking into Rive, the same way I'd build a real-time analytics panel in my day job.
The concept: A broadcast-style lower-third ticker, similar to what you'd see on a live sports or esports stream — except instead of scores, it surfaces trending GitHub repositories in real time. Repo name, star count, and primary language, updating continuously like a stat panel during a live broadcast.
How it's built:
Data Binding — I set up a View Model (VMTicker) with three properties (repoName, starCount, language) and bound them directly to text layers on the canvas. Star count uses a Number-to-String converter so it renders cleanly as text.
Rive Scripting (Luau) — This is the part I'm most proud of. I wrote a custom script that runs inside the artboard and cycles through a set of trending repos every few seconds, pushing fresh values into the View Model through context:rootViewModel(). It's a small simulation of what a live API feed would do, built entirely with Rive's native scripting layer — no external app or backend needed.
State Machine animation — A looped timeline animates the accent bar's opacity in a subtle pulse, so the UI feels "alive" even during the seconds between data updates — like a live broadcast indicator light.
Why this approach: Most broadcast UI concepts lean heavily on motion and character work. I leaned into what I actually know — data pipelines and dashboards — and used Rive's newer Scripting and Data Binding features to bring that thinking into a motion-design tool for the first time. It was also my first time using Rive Scripting, so a good chunk of the build was debugging Luau type errors and figuring out the runtime API through trial and error.
https://editor.rive.app/file/live-github-pulse/2466722
https://www.linkedin.com/posts/abuaasif_rive-uidesign-datavisualization-ugcPost-7490354984044154881-mIL_/?utm_source=share&utm_medium=member_desktop&rcm=ACoAACRm5rcB0nVG0_HUX6-IXfuWqNGquZ-jMQU