The network for creativity
Join 1.25M professional creatives like you
Connect with clients, get discovered, and run your business 100% commission-free
Creatives on Contra have earned over $150M and we are just getting started
Back to feedPost

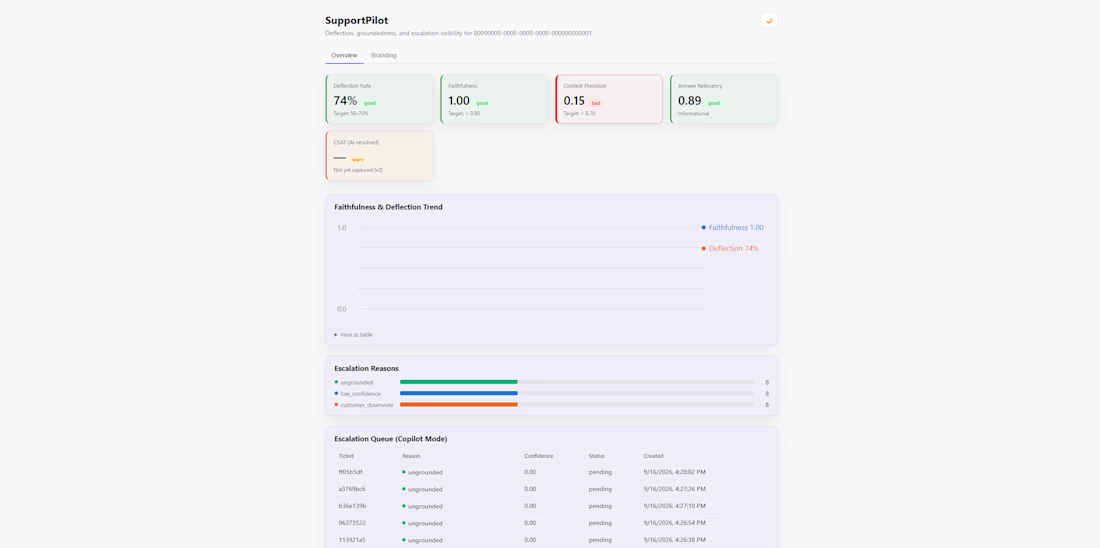
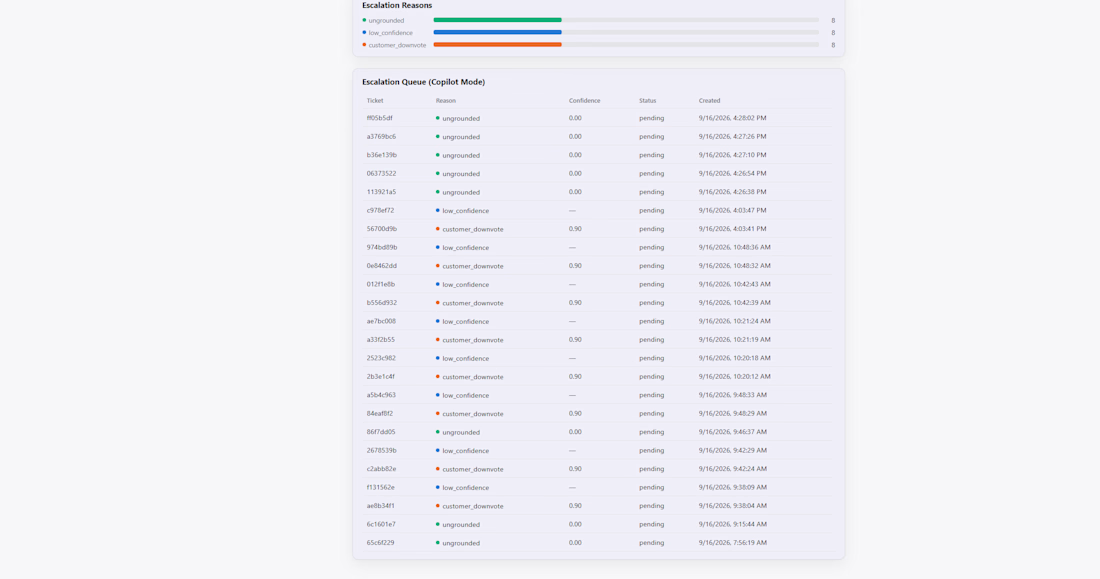
SupportPilot – Enterprise RAG Agent & Analytics Dashboard
Built a production-ready Retrieval-Augmented Generation (RAG) Support Agent system designed to reduce customer support ticket volume by 70%.
Key Features:
Zero-hallucination document grounding
Real-time Faithfulness and Accuracy tracking metrics
Live Deflection Rate analytics dashboard
Human Escalation Queue for complex queries Tech Stack: Python, LangChain, FastAPI, Vector DB (Pinecone), Vercel, Tailwind CSS.


The network for creativity
Join 1.25M professional creatives like you
Connect with clients, get discovered, and run your business 100% commission-free
Creatives on Contra have earned over $150M and we are just getting started

Challenges
View all


Related posts

YOUR DASHBOARD MIGHT BE LYING TO YOU.
Not because Power BI is wrong.
Because the data underneath it is.
A beautiful dashboard built on messy data doesn't create better decisions.
It creates confident mistakes.
Duplicates.
Missing values.
Inconsistent names.
Broken formats.
Multiple Excel files.
Numbers that don't agree.
Then someone adds a few colorful charts, calls it "analytics," and moves on.
I don't work that way.
I take the mess first.
RAW DATA → CLEAN → TRANSFORM → MODEL → ANALYZE → POWER BI → INSIGHTS
I work with Excel, CSV and business datasets to:
→ Clean and validate messy data
→ Transform data using Power Query
→ Combine multiple files and sources
→ Build data models and DAX measures
→ Create interactive Power BI dashboards
→ Identify trends, KPIs and business insights
→ Build reporting workflows that are easier to refresh and maintain
Because a dashboard shouldn't just look impressive.
Every KPI should answer a question.
Every visual should have a purpose.
And every number should be trustworthy.
That's the service I'm offering.
If your business data is sitting across messy Excel files, CSVs or scattered spreadsheets, I can turn it into:
Clean Data → Clear Analysis → Interactive Power BI → Better Decisions
You bring the data.
I'll find what it's trying to say.
📊 Power BI Dashboard & Data Analytics
Now available for freelance projects on Contra.


I actually 99.99% agree,
Furthermore Outliers removal is part of cleaning datasets we choose to begin a project, Descriptive statistics is a key for detection

🛠️ Show & Tell: AI Voice Receptionist — Retell AI + n8n + Google Sheets + Retool
Hey Contra community 👋
Just wrapped a full AI voice receptionist build for a home services client and wanted to share what went into it.
What it does:
Answers inbound calls 24/7 using Retell AI
Runs 3 real-time checks via n8n: service area · slot availability · customer lookup
Books the appointment live on the call — no double-booking
Logs to Google Sheets and fires a confirmation email automatically
Full Retool command center for the client to manage everything
The tricky part:
Retell AI has a toggle called "Payload: args only" — when enabled, it strips the parent wrapper from the webhook payload. Took a solid debug session to figure out why n8n kept returning empty data. Once I caught it and rebuilt the payload mapping, everything worked end to end.
Stack: Retell AI · n8n · Google Sheets · Retool MCP
Happy to answer questions on any part of the build — webhooks, n8n sub-workflow structure, Retool dashboard setup, whatever.
If you're a builder who gets overflow work in voice AI or home services automation, let's connect 🤝




Nice systems thinking in this build—the handoff between voice intake, availability checks, booking, and confirmation is clearly mapped to a real user outcome. The Retool command center also makes the automation legible instead of hiding it behind the scenes.

What makes an A/B test readout useful to a product team?
My preferred first page answers four questions:
What changed, and by how much?
How uncertain is the estimate?
Did an important guardrail get worse?
What decision does the evidence support, and what remains unresolved?
A result can be statistically significant and still too small to matter. An inconclusive result can still leave a meaningful gain or loss plausible. The decision needs more than a green badge.
I built an independent A/B analyzer to make these checks easier to inspect. The project includes a live demo, downloadable reports and documented limitations:
https://contra.com/p/mgoXb3qY-ab-test-analyzer-correct-p-values-power-and-fdr
If you work on product or CRO, what do you wish analysts put on the first page more often?
This is a strong framing of experiment readouts: separating signal, uncertainty, guardrails, and the actual decision keeps the team honest. The reminder that significance is not the same as usefulness is especially important.


