The network for creativity
Join 1.25M professional creatives like you
Connect with clients, get discovered, and run your business 100% commission-free
Creatives on Contra have earned over $150M and we are just getting started
Back to feedPost

-- Overview
Developed an end-to-end interactive Excel dashboard to analyze bank loan performance, borrower repayment behavior, and key default risk drivers across 9,500+ records in the banking & finance domain.
-- Key Highlights & Objectives
* Risk Identification: Evaluated critical financial indicators such as FICO Scores, Interest Rates, Debt-to-Income (DTI) ratios, Credit Policy compliance, and Loan Purpose to identify high-risk borrower segments.
* Interactive Analytics: Built a dynamic dynamic dashboard using Power Query, Pivot Tables, KPI Cards, and interactive Slicers for multi-dimensional data filtering.
* Actionable Insights: Provided data-driven recommendations to strengthen credit policy compliance, adjust risk-based pricing, and minimize potential loan default rates.
-- Tools & Technologies Used
* Microsoft Excel (Power Query, Pivot Tables, Pivot Charts, Slicers, KPI Cards, Conditional Formatting)
* Role: Data Analyst / Financial Analyst / Excel Specialist
* Skills: Data Visualization, Microsoft Excel, Financial Analysis, Dashboard Design, Risk Analysis, Data Cleaning (Power Query)

The network for creativity
Join 1.25M professional creatives like you
Connect with clients, get discovered, and run your business 100% commission-free
Creatives on Contra have earned over $150M and we are just getting started
Trending

Claude
Claude has entered the design space. How are you using it?

Contra University
Learn from expert creatives how to earn more using next-gen AI tools.
Brand Design
The best brand designers are on Contra. Scroll to see what's trending in brand design. What are you building?
creativeaiflow
Creative AI workflows are evolving. What tools do you use, and what are their strengths and weaknesses?
freelancerlife
Freelancer life is wins, pivots, and everything in between. What’s yours right now?



Related posts

🦈 Shark Tank Startup Intelligence Dashboard
Description
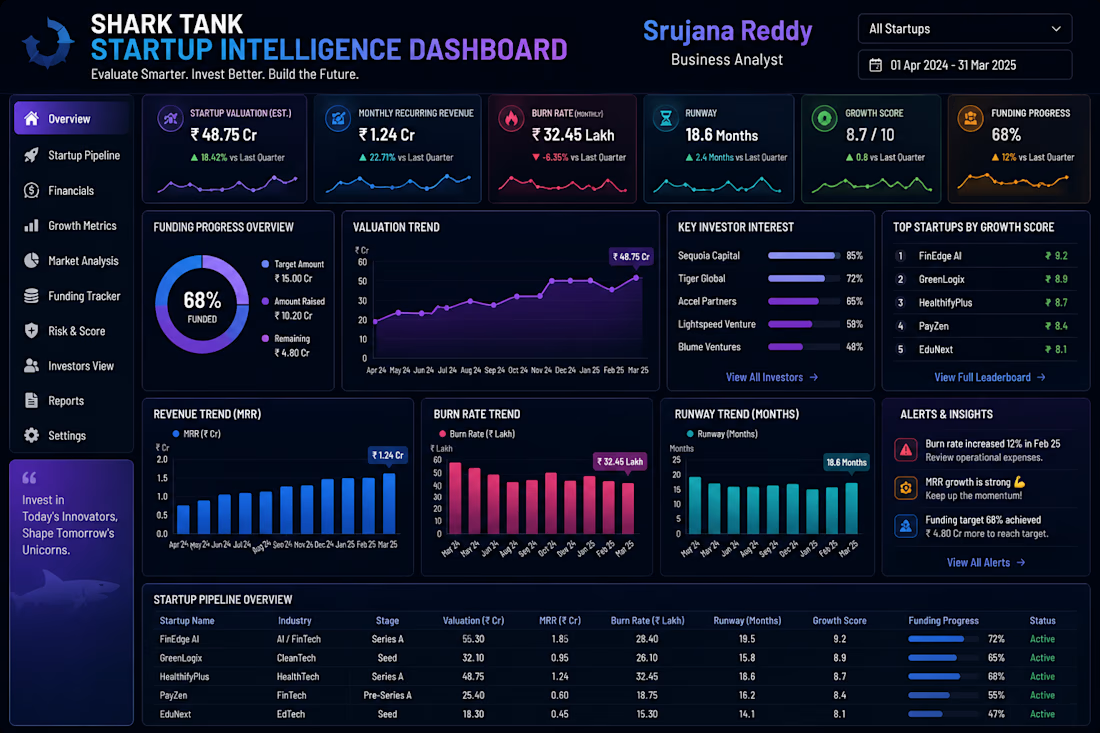
The Shark Tank Startup Intelligence Dashboard is an executive-level Business Intelligence solution designed to help investors, venture capital firms, startup founders, and business consultants evaluate startup performance through data-driven insights. It provides a centralized view of key startup metrics, enabling smarter investment decisions and business growth analysis.
This dashboard tracks critical business indicators such as Startup Valuation, Monthly Recurring Revenue (MRR), Burn Rate, Runway, Growth Score, Funding Progress, Revenue Trends, Investor Interest, and Startup Performance Rankings. Interactive KPI cards and dynamic visualizations help users quickly assess financial health, growth potential, funding status, and operational sustainability.
It also features Funding Progress Overview, Valuation Trends, Revenue & Burn Rate Analysis, Investor Interest Tracking, Startup Pipeline Management, Growth Leaderboards, and Smart Alerts & Insights, allowing stakeholders to identify high-potential startups, monitor funding milestones, manage financial risks, and make confident investment decisions.
Built using Microsoft Power BI, SQL, Microsoft Excel, Power Query, and DAX, this dashboard transforms complex startup data into clear, actionable insights that support strategic planning, fundraising, and executive reporting.
Key Features
🦈 Startup Valuation Analysis
💰 Monthly Recurring Revenue (MRR) Tracking
🔥 Burn Rate & Runway Monitoring
📈 Funding Progress Dashboard
🚀 Startup Growth Score
👨💼 Investor Interest Analysis
📊 Startup Performance Rankings
🚨 Smart Alerts & Business Insights
📋 Executive Investment Dashboard
Client Note
The Shark Tank Startup Intelligence Dashboard is built for investors, venture capital firms, accelerators, incubators, startup founders, and business advisors who need a clear and reliable view of startup performance. By combining financial metrics, growth indicators, and investment insights into one interactive dashboard, it helps evaluate opportunities, monitor funding progress, reduce investment risk, and support confident, data-driven business decisions. Each dashboard can be fully customized to match your organization's investment strategy and reporting requirements.



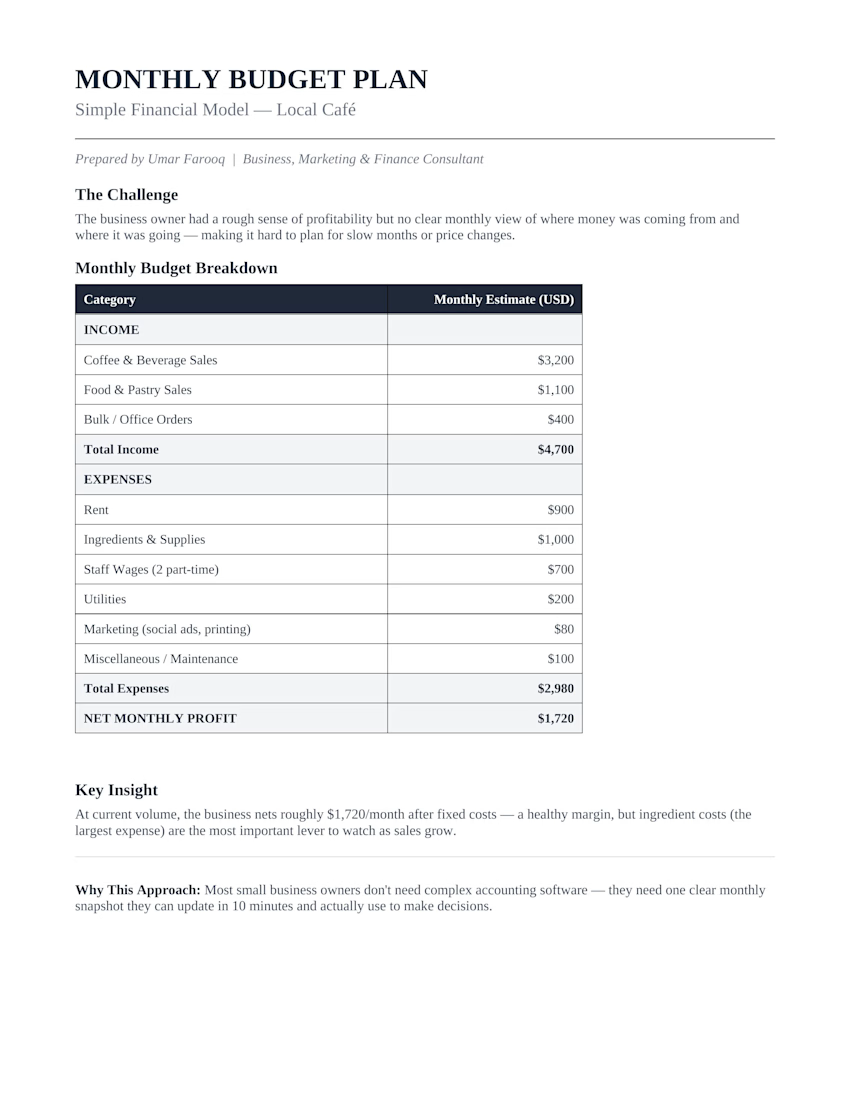
Monthly Budget Plan — Simple Financial Model for a Local Café


Olist is a Brazilian tech & e-commerce company founded in 2015 in Curitiba, Paraná. The dataset collected from Kaggle is full of missing values and mismatched data, a lot of typos. I tried to build a report based on the collected data. I cleaned up much of the data, corrected typos of a millions rows. When I started building the report i did not notice any issue until I want to build some KPIs, then I went back where I pulled the data and found a lot of comments stating how many things miss. Then I said to my self, what if the data were like that, what would it mean for a business.