The network for creativity
Join 1.25M professional creatives like you
Connect with clients, get discovered, and run your business 100% commission-free
Creatives on Contra have earned over $150M and we are just getting started
Back to feedPost

Boozia - WP-Bakery to Elementor Pro || WordPress


The network for creativity
Join 1.25M professional creatives like you
Connect with clients, get discovered, and run your business 100% commission-free
Creatives on Contra have earned over $150M and we are just getting started


Related posts


TOP!!

𝗗𝗮𝘆 𝟮𝟳𝘁𝗵 𝗼𝗳 𝟯𝟬𝗱𝗮𝘆𝘀, 𝟯𝗱𝗮𝘆𝘀 𝘁𝗼 𝗴𝗼
𝗪𝗼𝗿𝗱𝗣𝗿𝗲𝘀𝘀 𝗛𝗲𝗮𝗱𝗹𝗲𝘀𝘀 𝘃𝘀 𝗕𝗹𝗼𝗰𝗸 𝗧𝗵𝗲𝗺𝗲𝘀: 𝗖𝗵𝗼𝗼𝘀𝗶𝗻𝗴 𝘁𝗵𝗲 𝗥𝗶𝗴𝗵𝘁 𝗠𝗼𝗱𝗲𝗿𝗻 𝗔𝗿𝗰𝗵𝗶𝘁𝗲𝗰𝘁𝘂𝗿𝗲
Should you go headless or stick with native Full Site Editing block themes?
𝗜𝗻 𝟮𝟬𝟮𝟲:
• Choose Block Themes (FSE) if you want fast development, lower server costs, and native plugin compatibility.
• Choose Headless if you need multi-channel publishing, app integrations, or strict enterprise security isolation.
𝗪𝗵𝗮𝘁'𝘀 𝘆𝗼𝘂𝗿 𝘁𝗵𝗼𝘂𝗴𝗵𝘁 ?


Love this comparison

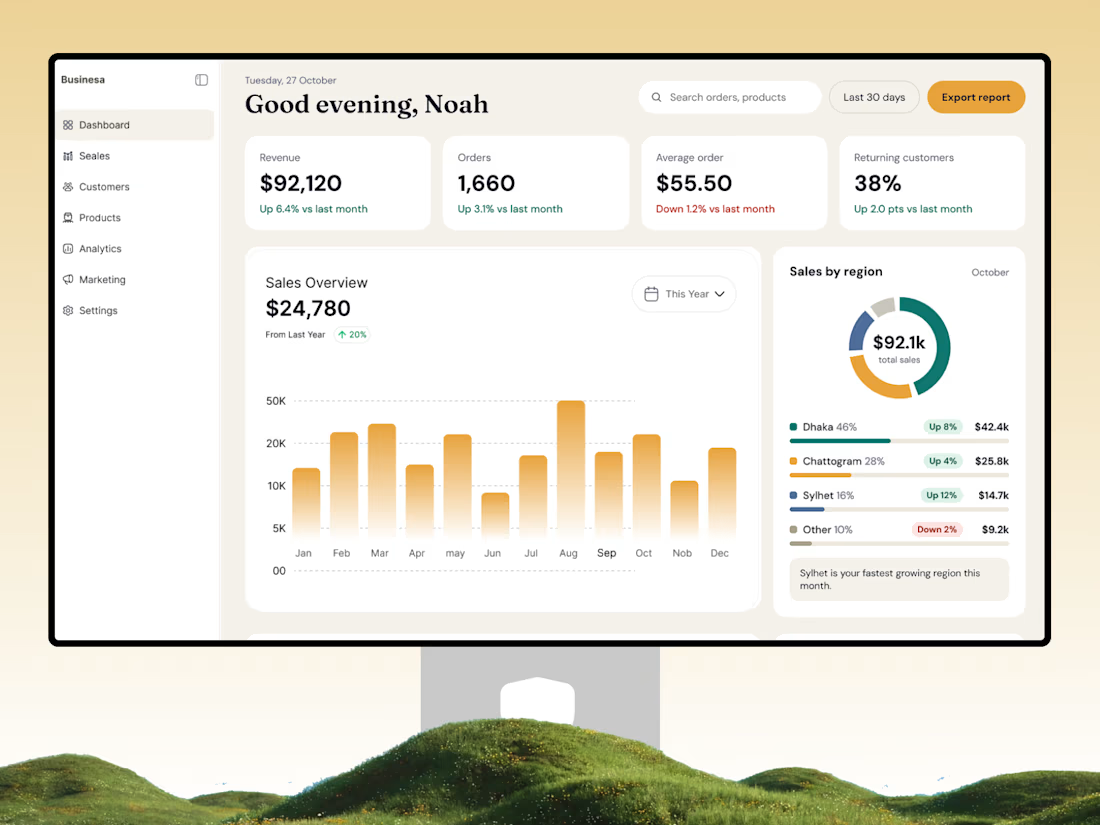
📊 Turn Business Data into Smarter Decisions
A great dashboard doesn't just display numbers — it helps businesses understand performance and make better decisions.
Introducing a modern Store Analytics Dashboard UI/UX Design by OrdainIT, designed for eCommerce businesses that need a clear view of their store performance.
✨ Design highlights:
Clean and intuitive dashboard interface
Revenue, orders, and customer analytics
Interactive sales overview and visual charts
Regional sales performance tracking
Key business metrics at a glance
Organized navigation and user-friendly layout
The goal is to simplify complex business data through a clean, structured, and easy-to-understand interface.
At OrdainIT, we design modern SaaS dashboards and digital products that combine usability with visual clarity.
💬 What's the most important metric you want to see first when opening an analytics dashboard?
#DashboardDesign #UIUXDesign #SaaSDesign #AnalyticsDashboard #ProductDesign #WebDesign #OrdainIT


That serif heading works so well.