The network for creativity
Join 1.25M professional creatives like you
Connect with clients, get discovered, and run your business 100% commission-free
Creatives on Contra have earned over $150M and we are just getting started
Back to feedPost

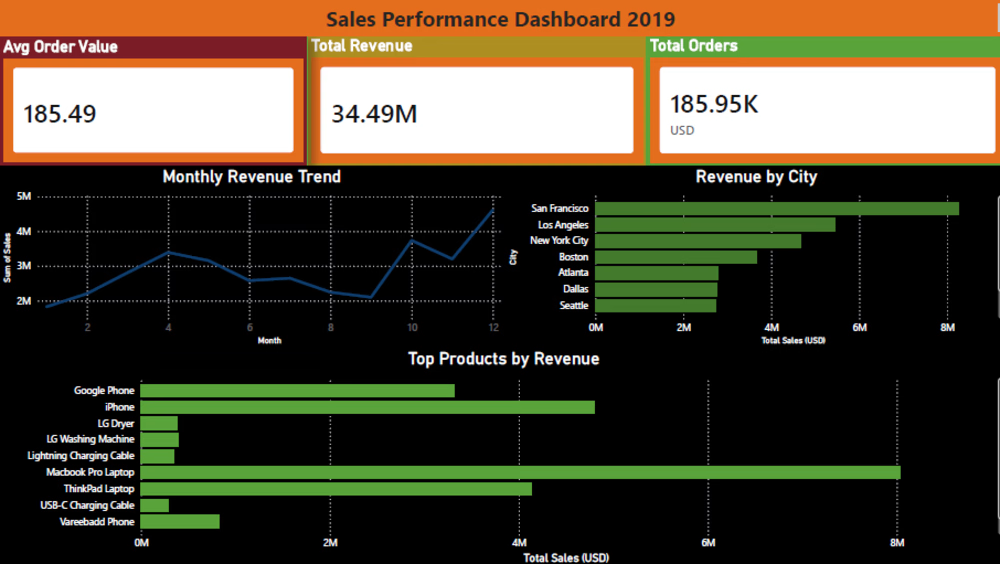
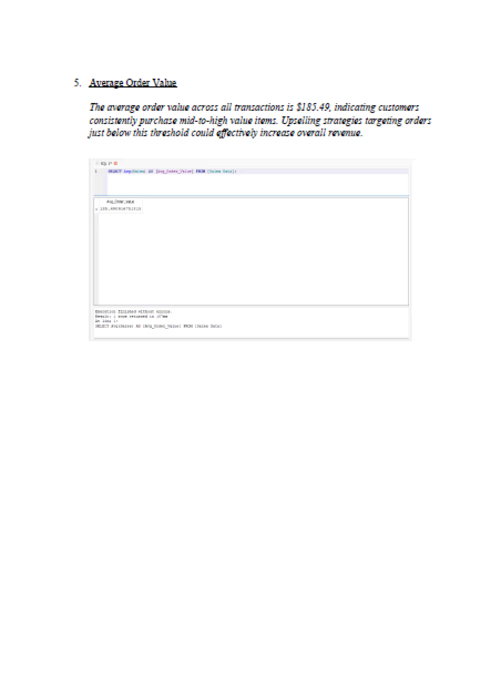
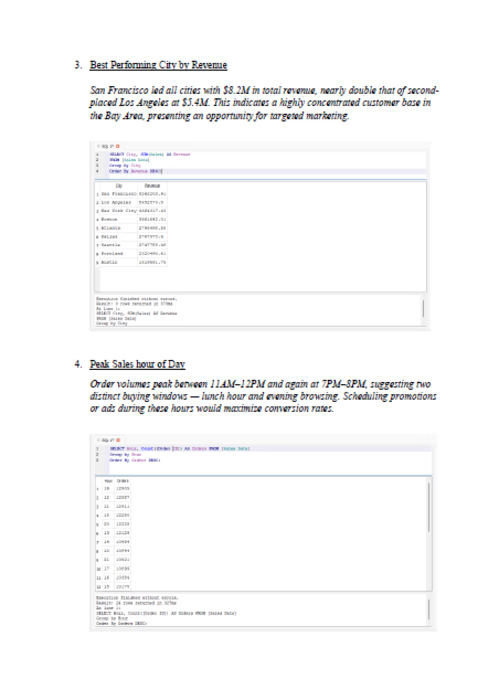
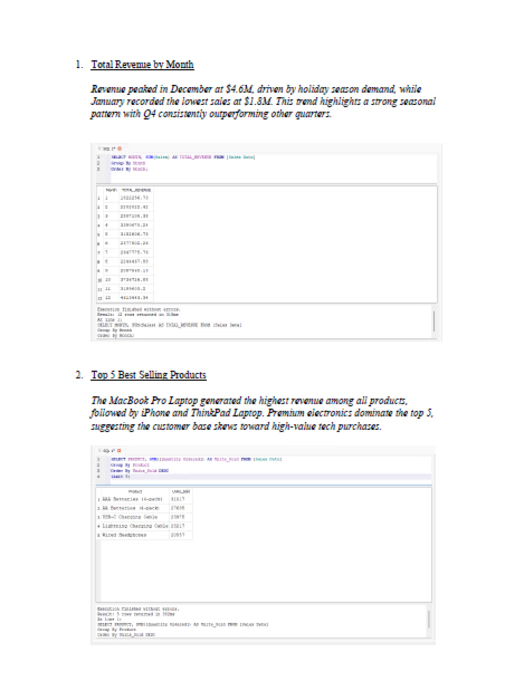
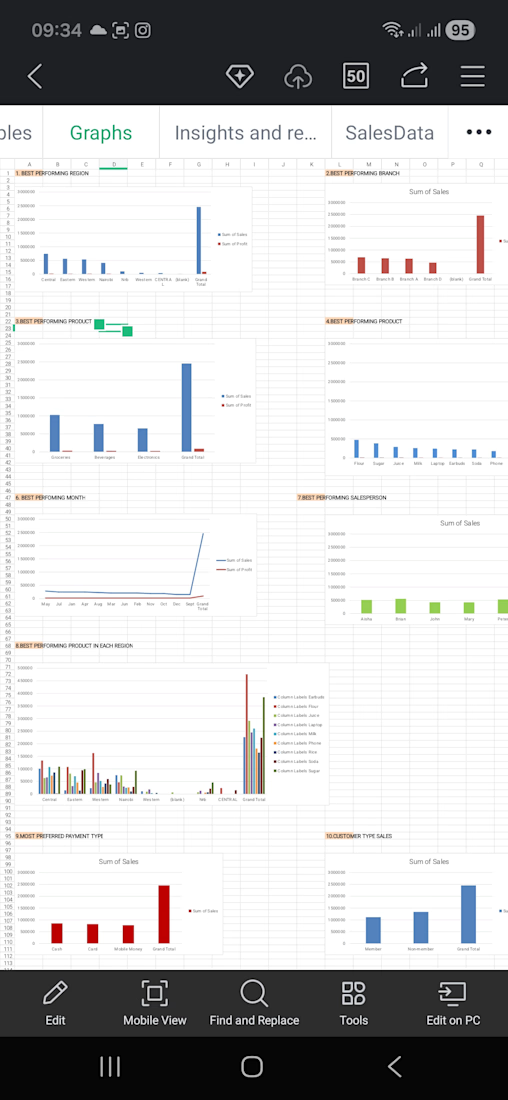
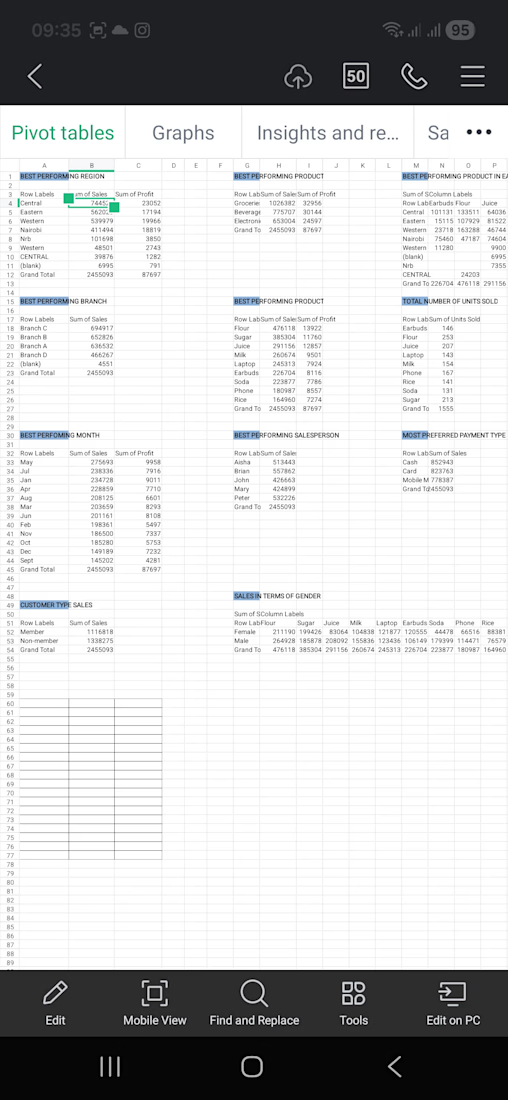
Performed end-to-end data analysis on a 12-month sales dataset containing 185,000+ orders across multiple US cities and product categories. Using SQL, I extracted key business insights including monthly revenue trends, top performing products, city-level revenue breakdown, and peak sales hours. Built a professional Power BI dashboard featuring KPI cards (Total Revenue $34.49M, Total Orders 185.95K, Avg Order Value $185.49), monthly trend line chart, revenue by city bar chart, and top products analysis. Delivered both a SQL analysis report and an interactive Power BI dashboard as final deliverables.


The network for creativity
Join 1.25M professional creatives like you
Connect with clients, get discovered, and run your business 100% commission-free
Creatives on Contra have earned over $150M and we are just getting started
Related posts



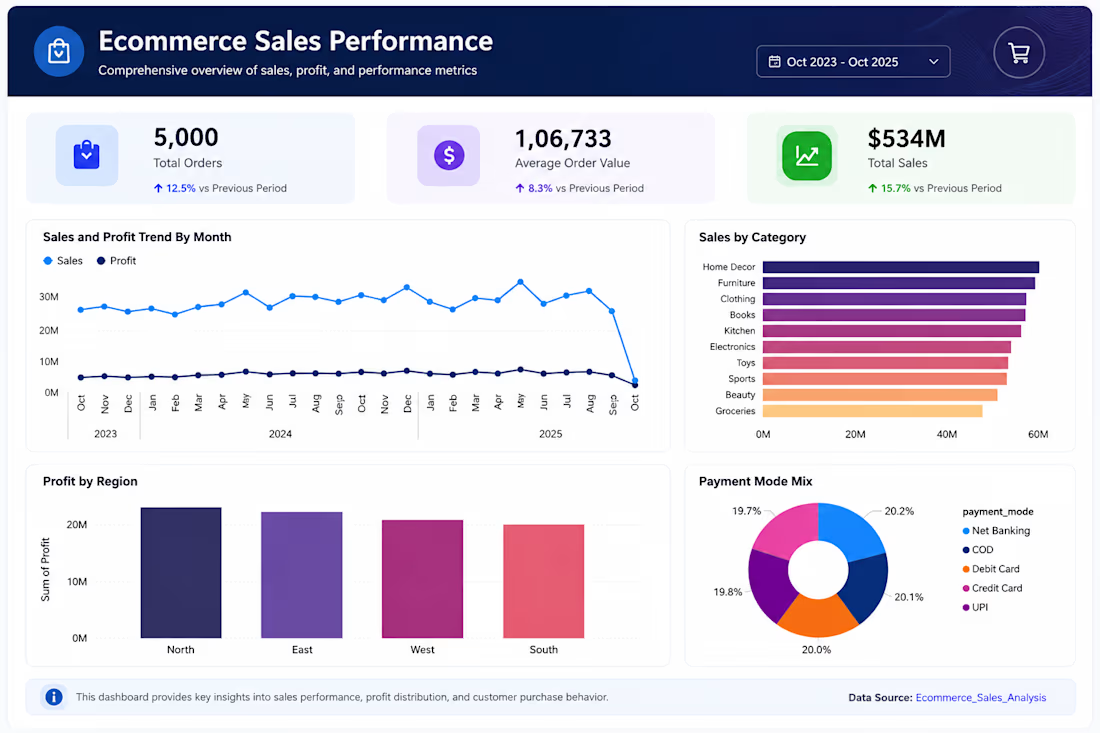
📊 Ecommerce Sales Performance Dashboard
Built an interactive Power BI dashboard to analyze ecommerce sales data.
🔹 Key Features:
• KPI cards for Total Orders, Average Order Value & Sales
• Monthly Sales & Profit Trend
• Category-wise Sales Analysis
• Regional Profit Distribution
• Payment Method Breakdown
🛠️ Tools Used:
Power BI • DAX • Excel • Data Visualization
This project demonstrates how business intelligence can transform raw sales data into actionable insights.
Data AnalysisData ScienceMicrosoft ExcelSQLpowerbidataanalyticsbusinessintelligenceData VisualizationMicrosoft Power BI

Project Title
Executive Financial Performance & Operations Dashboard
Project Overview
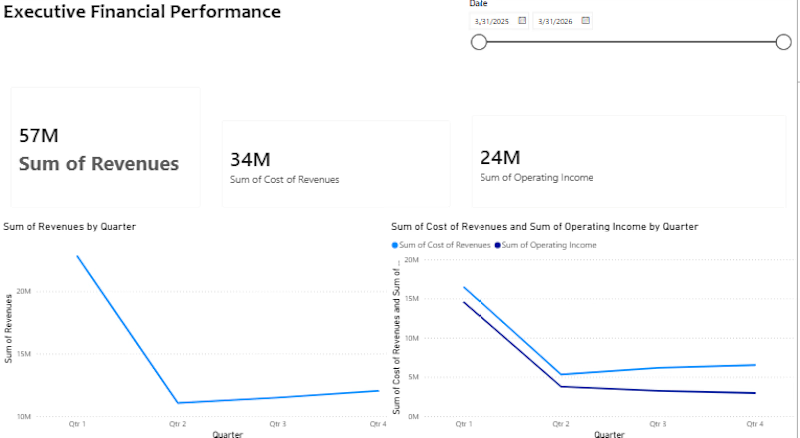
Developed a comprehensive, interactive corporate financial dashboard in Power BI to track key organizational metrics, revenue trends, and operational costs. The project involved transforming raw data into an executive-level visual report, enabling leadership to make data-driven decisions regarding profitability and quarterly financial health.
My Role
Data Analyst & Business Intelligence Developer
Data Modeling & Architecture: Connected financial data points to establish a clean data structure for accurate calculation.
Dashboard Layout & UX Design: Architected the complete visual layout from scratch, ensuring a professional corporate skeleton with intuitive navigation.
KPI & Metric Configuration: Built and formatted essential executive KPI cards (including Sum of Revenues, Cost of Revenues, and Operating Income) utilizing automated display units ($M$).
Interactive Analytics: Implemented a dynamic Date Slicer and interactive timeline controllers to allow users to filter metrics by custom periods.
Data Visualization: Created synchronized quarterly trend line charts to track financial performance shifts across specific fiscal quarters.
Project Details & Metrics
Tools Used: Power BI Desktop, Data Modeling, Data Visualization, Dashboard Design.
Key Deliverables:
An executive header and streamlined navigation layout.
High-level KPI blocks displaying primary financial health indicators ($57\text{M}$ Revenue metrics).
Side-by-side quarterly trend charts comparing revenues against operating costs and income.
An interactive timeline controller for dynamic time-period filtering.








Trending

Claude
Claude has entered the design space. How are you using Claude Design?

Contra University
Learn from expert creatives how to earn more using next-gen AI tools.
fifaworldcup2026
The World Cup is here and the whole world's watching. How are you designing for the world stage?
creativeaiflow
Creative AI workflows are evolving. What tools do you use, and what are their strengths and weaknesses?
freelancerlife
Freelancer life is wins, pivots, and everything in between. What’s yours right now?