The network for creativity
Join 1.25M professional creatives like you
Connect with clients, get discovered, and run your business 100% commission-free
Creatives on Contra have earned over $150M and we are just getting started
Back to feedPost

I once watched users silently disappear from our app without knowing why. We guessed. We assumed. We redesigned based on hunches. But churn kept climbing.
Then we asked one simple question: "What would make you stay?"
That moment changed everything.
Most founders never know why users leave. We were losing 34% within the first month with no idea why.
So I created a retention survey appearing right before churn moments. Churn dropped 41% in three weeks.
Your churning users hold the answers. Ask them before they leave. Listen to their hesitations. Then act on it.
The difference between losing users and keeping them isn't guesswork. It's asking the right question at the right time.
Every user who leaves sends a signal. Most companies ignore it. The ones who don't? They win.
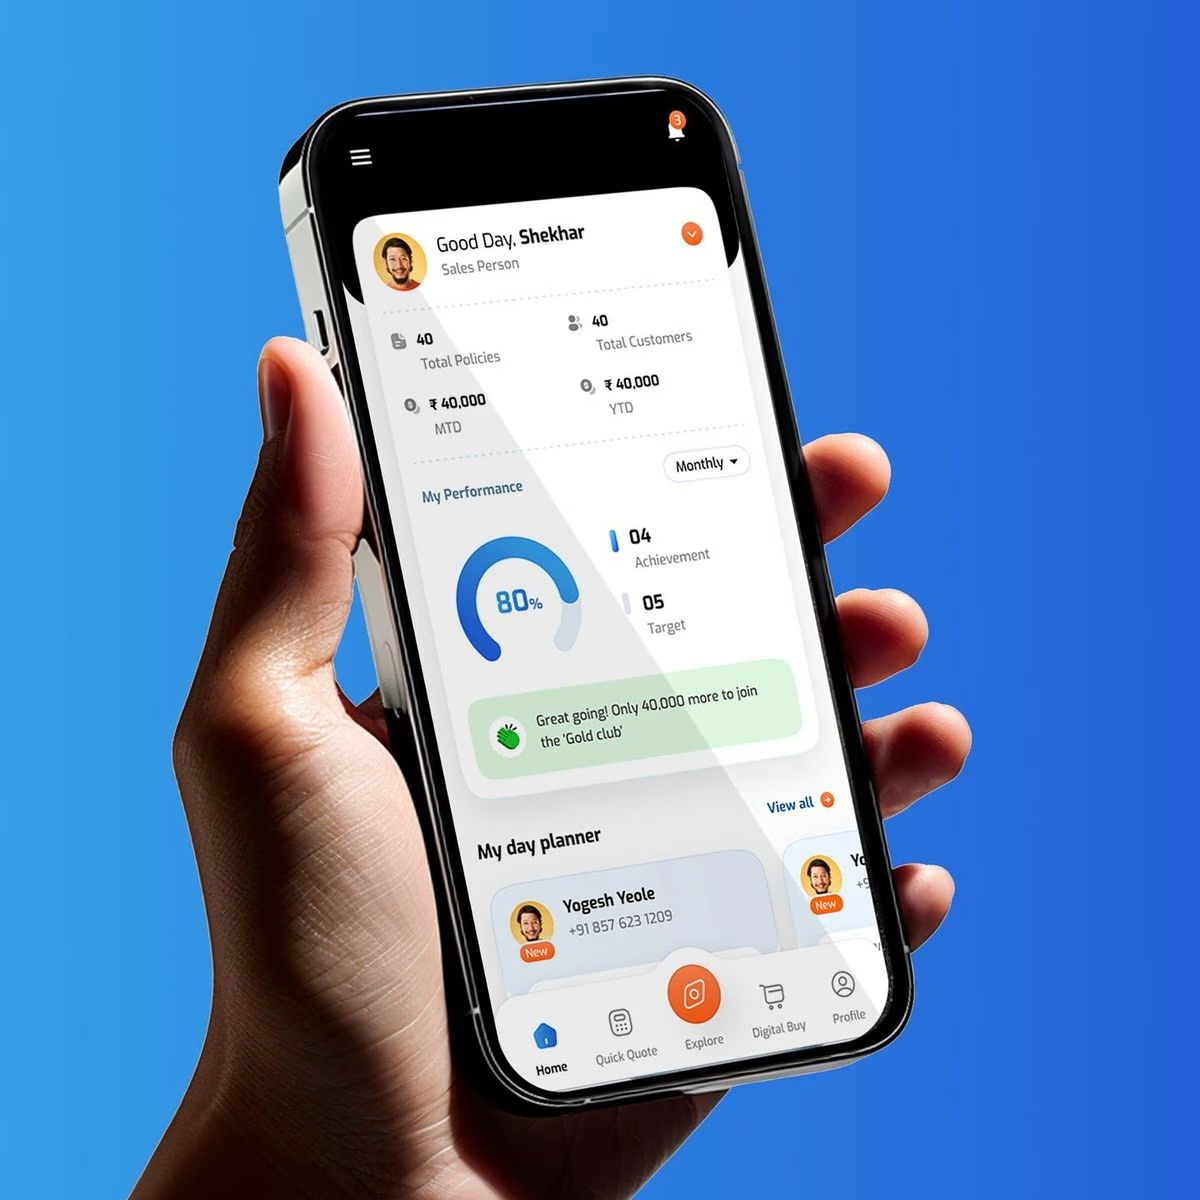

What I was discussing with my CEO just last week, totally agree to this 👍
The network for creativity
Join 1.25M professional creatives like you
Connect with clients, get discovered, and run your business 100% commission-free
Creatives on Contra have earned over $150M and we are just getting started





Related posts

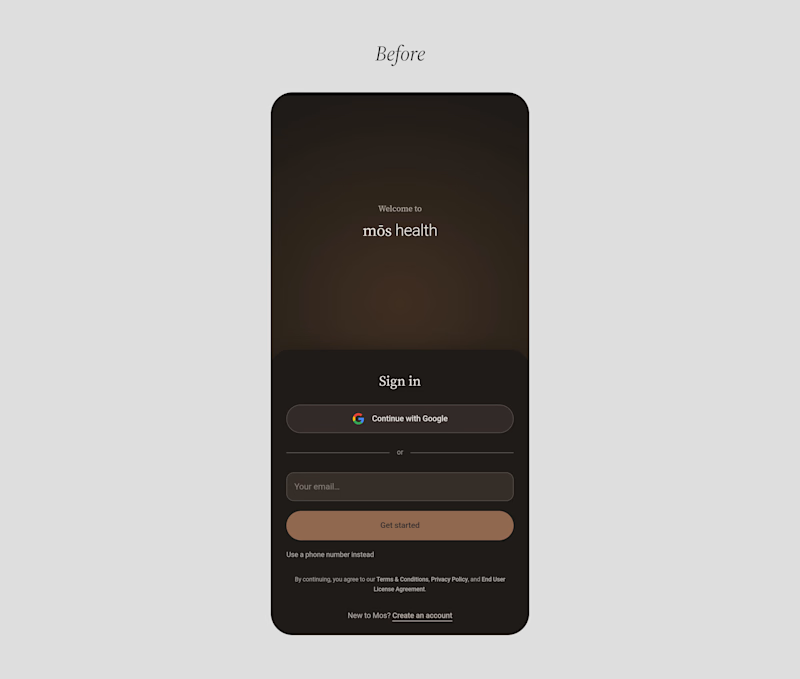
A founder ask me for a feedback on there product, so i started reviewing the healthcare app, and something felt off.
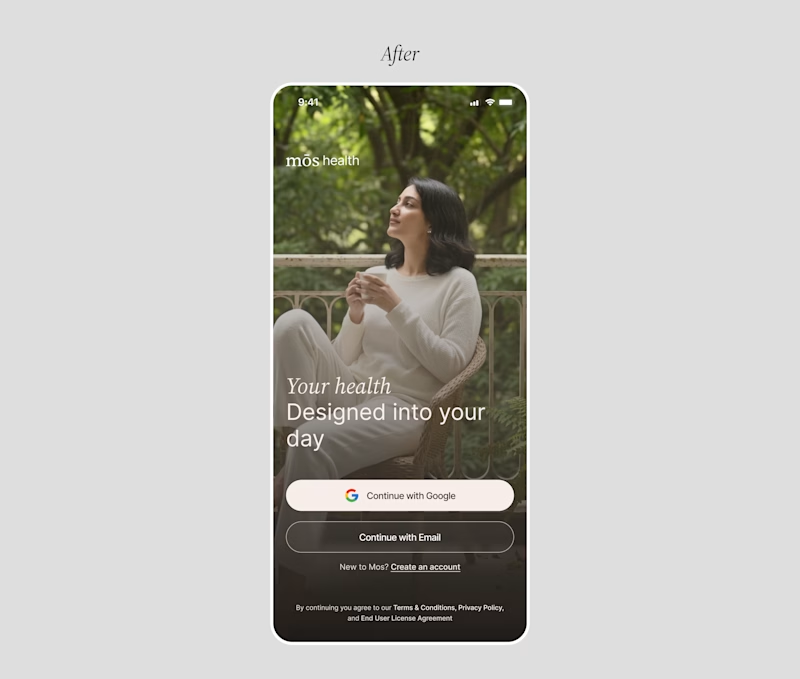
The website felt warm and welcoming. You could tell there were real people behind the brand.
But once you opened the app to sign up, that feeling was gone.
And honestly, for something as personal as healthcare, that matters. People need to feel comfortable before they trust you with their health.
So I worked on the onboarding screen to bring that feeling back.
Nothing complicated. I added a human touch through imagery and kept the screen simple, while making the app feel more connected to the website.
Sometimes, it's not about adding more to a screen. It's about making what's already there feel right.
Which would make you more comfortable signing up:
Before or After?

28 votes
Ends in 1h

Good catch on the disconnect between the website and signup flow. Carrying that human warmth into onboarding feels especially relevant for healthcare. Have you had a chance to test the redesign with new users?

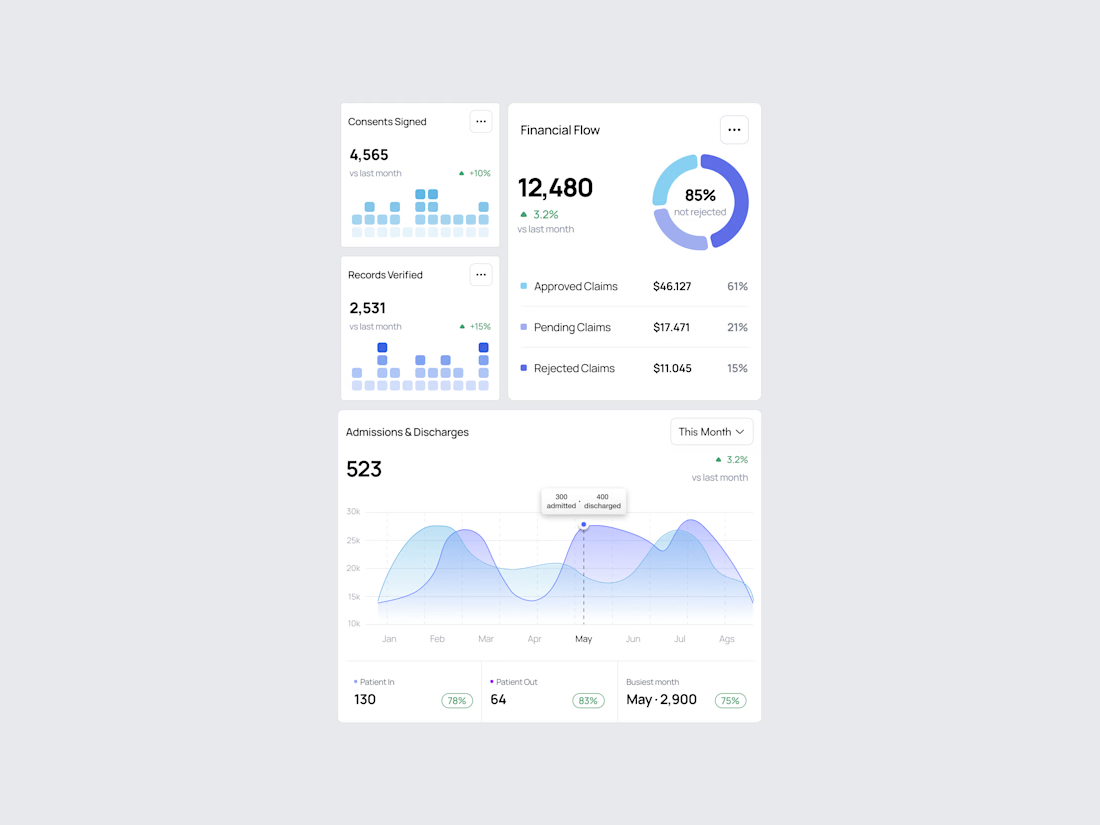
Clear data, soft cards, and quick access to what needs review 🩺🪻
#uidesign #uxdesign #healthcareapp #mobileapp #figma

Ceya Website Design & Development, 2025.
Ceya’s identity getting featured here, the website is now live in my portfolio too. 🟢 Same brand, next chapter: eight IT services in one clear structure, with green saved only for action.
Full case study 👉 https://serkanhursgunel.com

Stellar work!