The network for creativity
Join 1.25M professional creatives like you
Connect with clients, get discovered, and run your business 100% commission-free
Creatives on Contra have earned over $150M and we are just getting started
Back to feedPost

Income & Expenditure Statistical Analysis
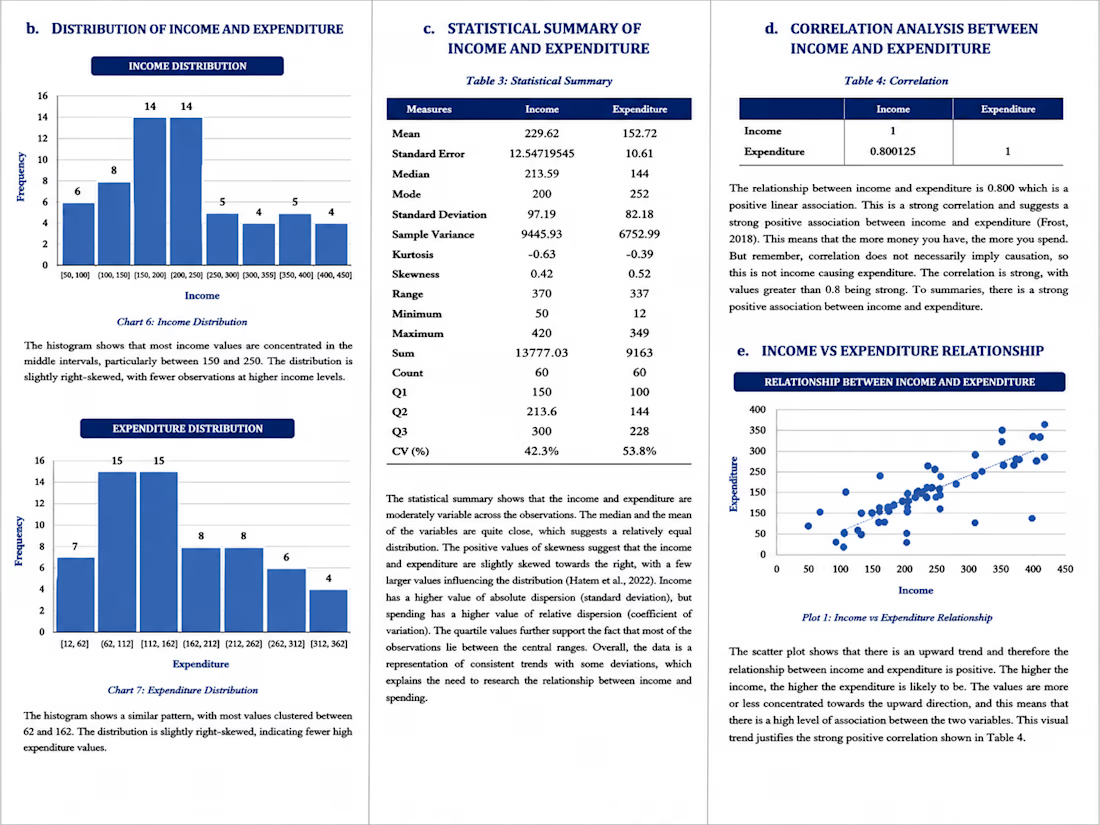
Completed a quantitative data analysis project focused on examining income and expenditure patterns within a client dataset. I carried out a structured statistical analysis to identify distribution patterns, variation, and the relationship between the two variables.
The work included calculating and interpreting descriptive statistics such as mean, median, mode, standard deviation, variance, range, quartiles, skewness, and coefficient of variation. I also analyzed income and expenditure distributions using histograms and presented the results through professionally formatted statistical tables.
To examine the relationship between income and expenditure, I conducted correlation analysis and developed a scatter plot to visually communicate the findings. The analysis identified a strong positive correlation (r = 0.800), which was clearly interpreted and incorporated into the research report.
I transformed the statistical output into clear, client-ready findings with organized tables, charts, visualizations, and concise written interpretation suitable for academic and research reporting.

The network for creativity
Join 1.25M professional creatives like you
Connect with clients, get discovered, and run your business 100% commission-free
Creatives on Contra have earned over $150M and we are just getting started







Related posts

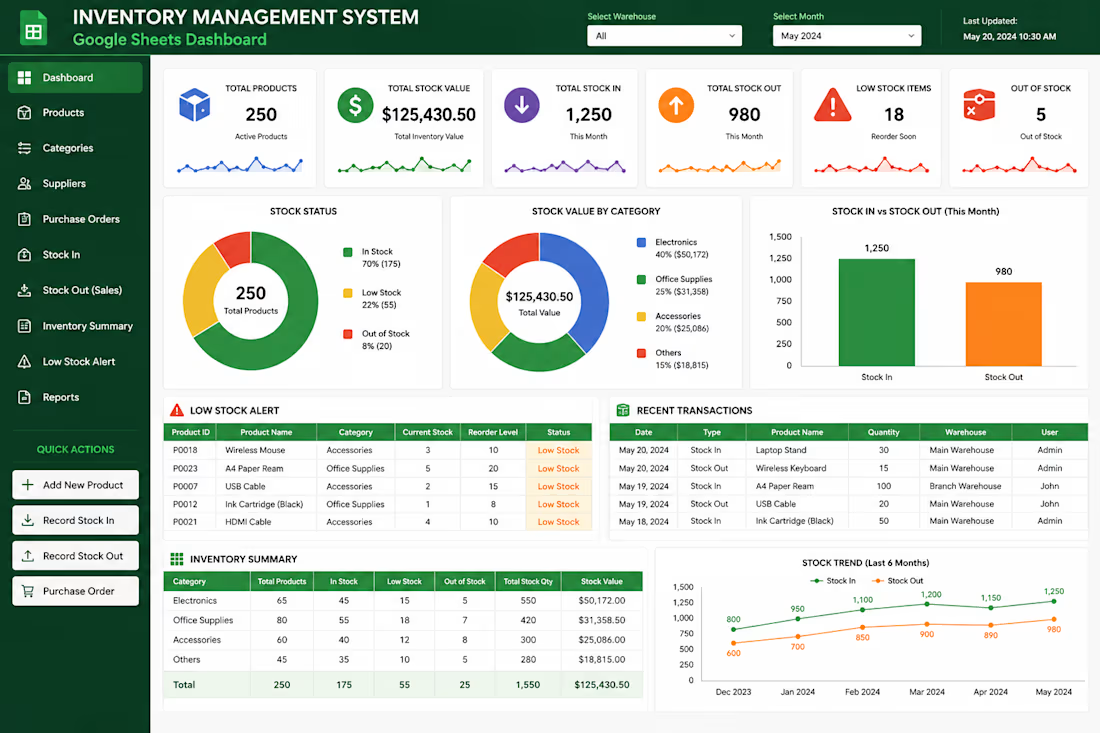
I developed an Excel-based inventory management solution to organize product records, monitor stock levels, and simplify inventory tracking. The system helps users maintain structured data, review stock information, and improve day-to-day inventory management through spreadsheet automation and clear reporting.

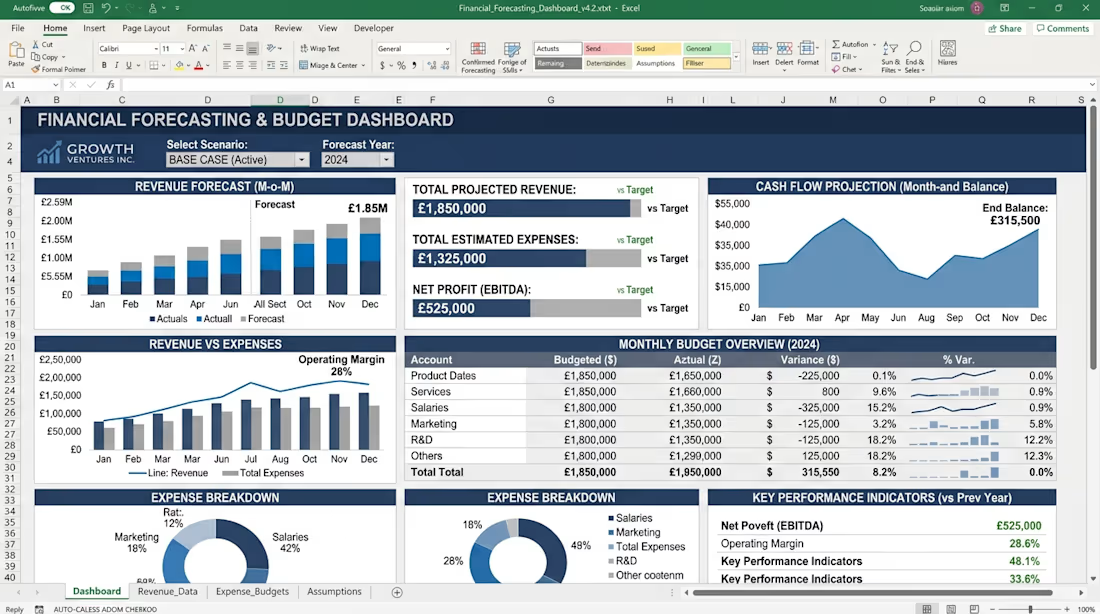
I developed a professional Excel Financial Reporting Dashboard to simplify financial data analysis and reporting. It presents key financial metrics, performance trends, and interactive charts in a clear, organized format. Using Excel formulas, data analysis, and Power Query, the solution helps streamline reporting, improve data visibility, and support better business decisions.


This how we are going to distribute your press release and he will be published and i share you proof for the publications


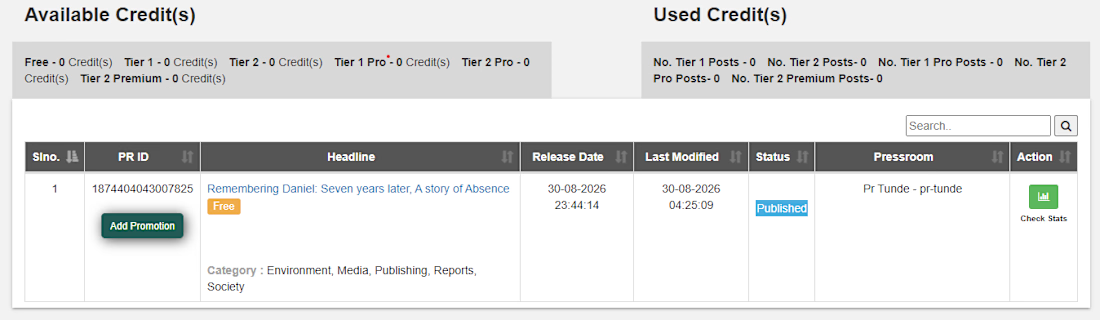

That format looks exactly like an automated spam template rather than a real marketing update. I would not trust a service that claims to distribute press releases through WhatsApp or ChatGPT without verifiable proof of publication.