The network for creativity
Join 1.25M professional creatives like you
Connect with clients, get discovered, and run your business 100% commission-free
Creatives on Contra have earned over $150M and we are just getting started
Back to feedPost

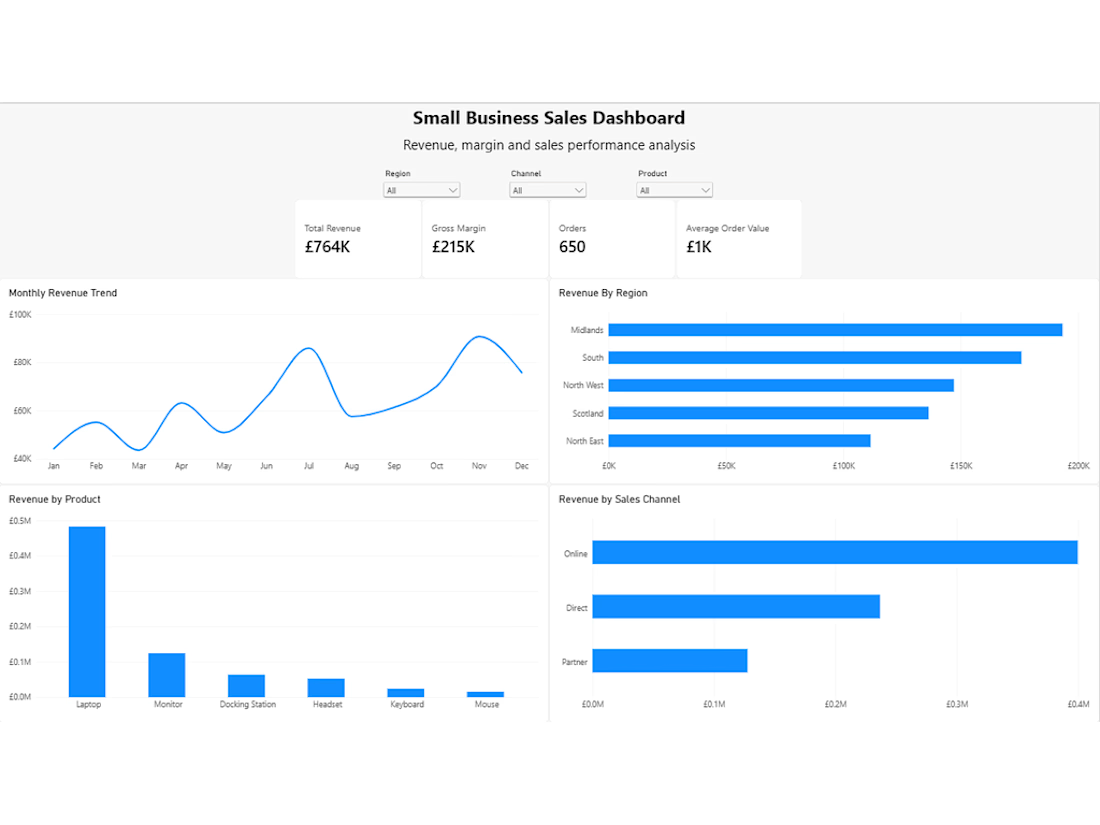
A Power BI dashboard created to analyse sales performance for a fictional small business.
The dashboard provides an overview of revenue, gross margin, orders and average order value, with interactive filters for region, sales channel and product.
It also includes monthly revenue trends and breakdowns by region, product and sales channel, making it easier to identify performance trends and compare results.


The network for creativity
Join 1.25M professional creatives like you
Connect with clients, get discovered, and run your business 100% commission-free
Creatives on Contra have earned over $150M and we are just getting started
Trending
retrofuturism
Share your favorite designs from the past exploring the distant future. Or your own take on the aesthetic 🚀
halftone
Dots. Texture. Grain. Let's see your designs using the halftone technique.

Midjourney
Creatives are showing off what they're making with Midjourney.
colorgrade
Video editors sound off: How do you enhance the mood of your video in color grading?





Related posts


Exploring two visual directions for a data visualization component.
Light & minimal vs Dark & bold - which one feels better for a modern dashboard?
Vote below 👇 Would love to know why.
#UIDesign #UXDesign #DashboardDesign #DataVisualization #ProductDesign #Figma


0 voted
0%

9 voted
100%

9 votes
Closed

Light one is making the data easier to scan. 😊

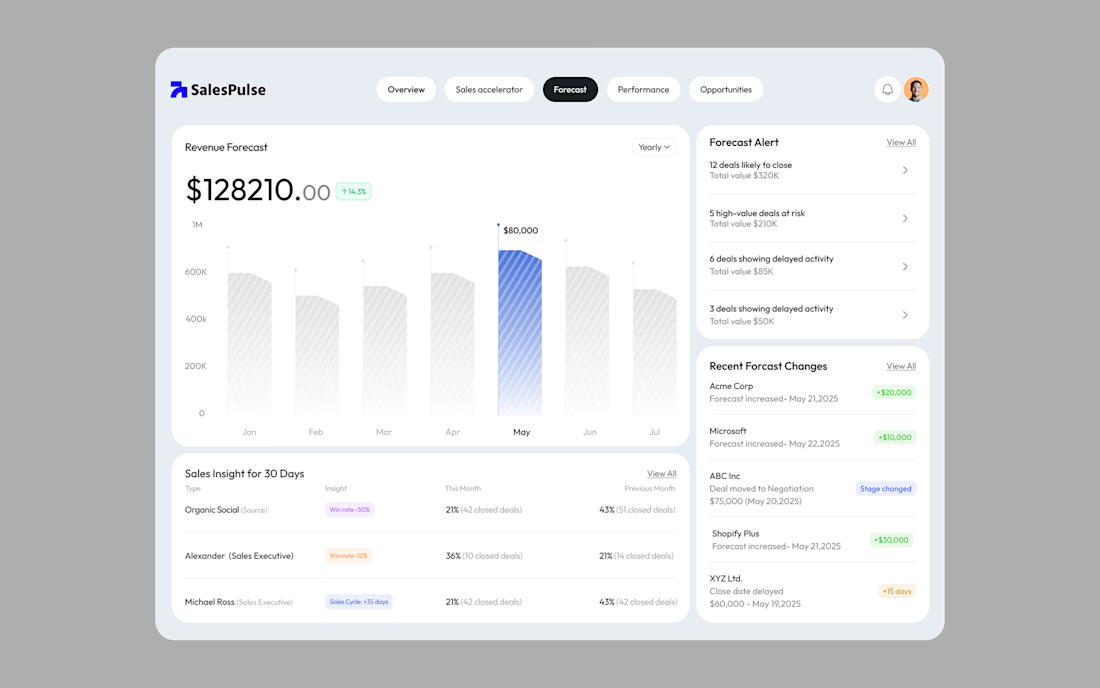
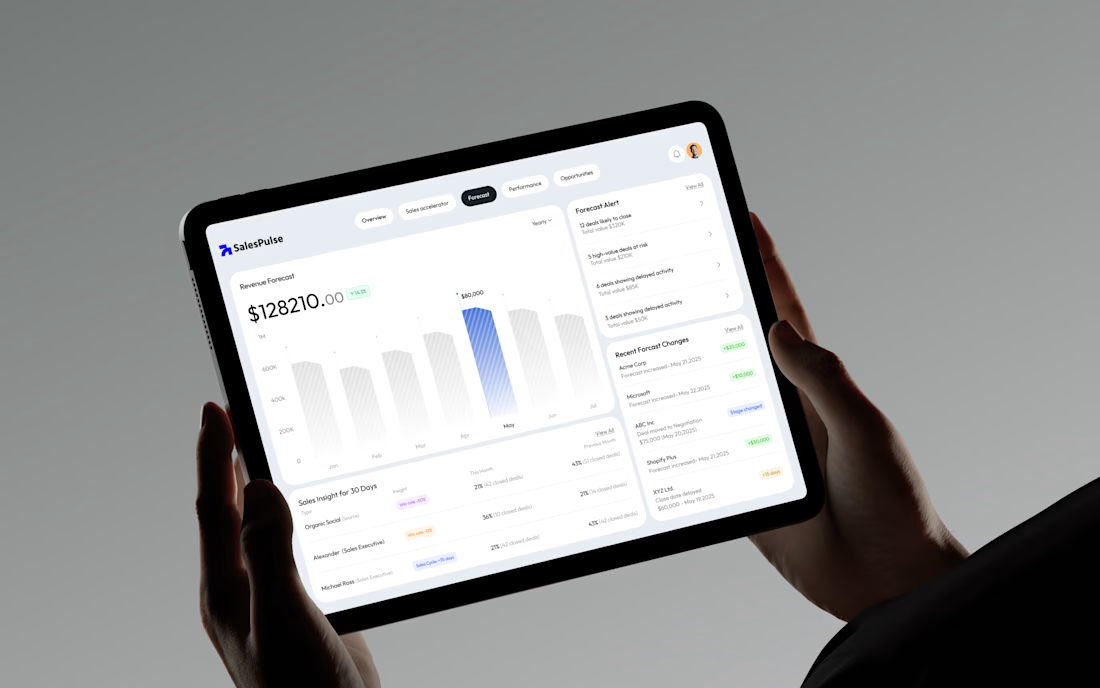
Forecasting is useful when it helps teams understand what is likely to happen next, not just what happened before.
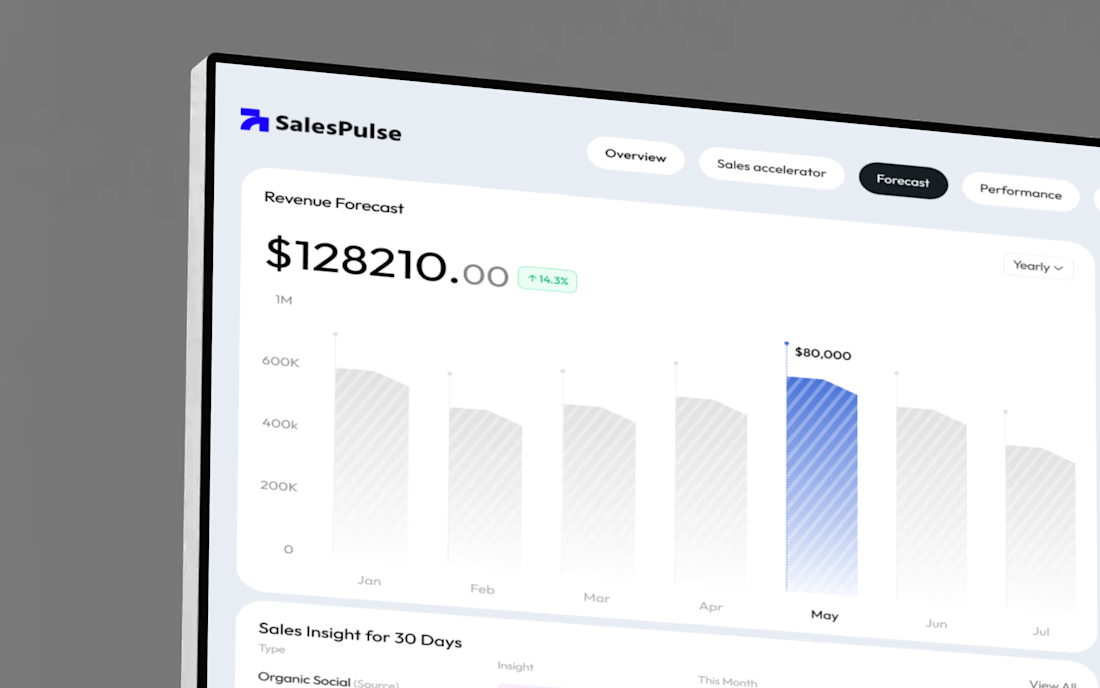
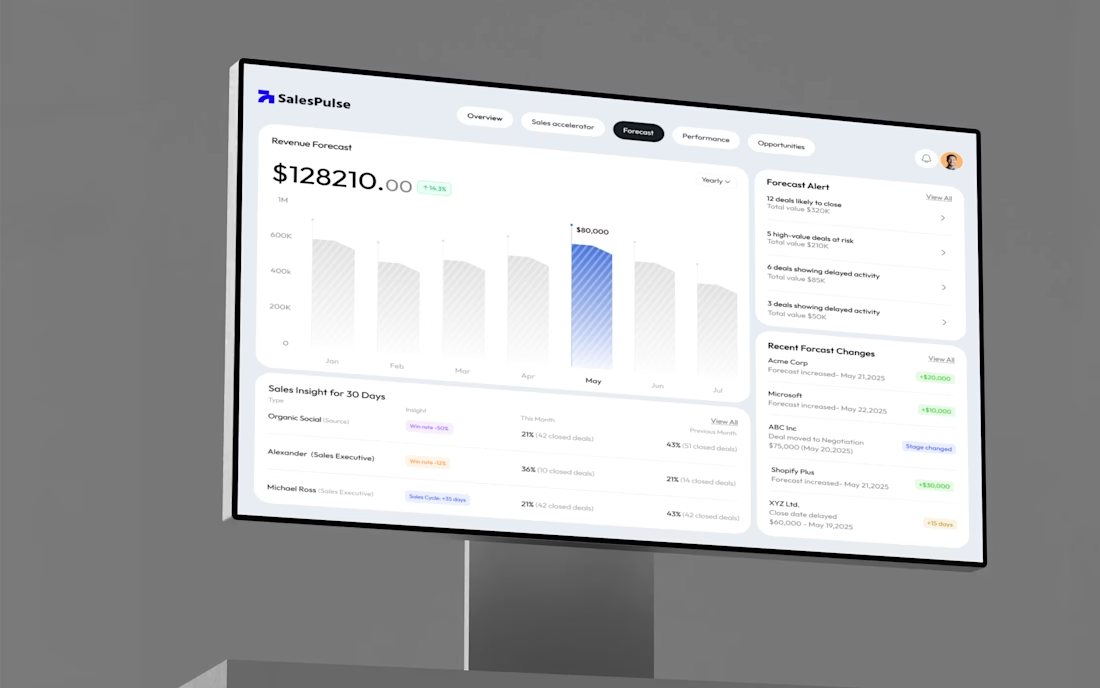
This sales forecast dashboard brings revenue projections, deal risk, sales insights, and recent forecast changes into one clear workspace for B2B teams.

You have the numbers.
But do you actually know what's happening in your business?
Sales reports. Customer data. Spreadsheets. Monthly numbers.
There may be plenty of data sitting in front of you, but still no clear answer to questions like:
→ Which products are actually performing well?
→ When are sales increasing or declining?
→ What are customers buying?
→ Where are you losing opportunities?
→ What needs your attention first?
Having data isn't the same as understanding it.
This is where data analysis can help.
Instead of looking at hundreds or thousands of rows individually, I organize and analyze the data to find the patterns that matter.
For example, in a recent coffee sales analysis project, I looked at sales performance, product trends, and customer purchasing patterns and presented the results through an interactive dashboard.
The goal wasn't to create more numbers.
It was to make the existing numbers easier to understand.
Good decisions start with knowing what's actually happening.
If your business data is sitting in spreadsheets but you're still unsure what the numbers are telling you, that's a problem worth solving.
#DataAnalysis #BusinessAnalytics #Excel #PowerBI #DataAnalytics #BusinessInsights
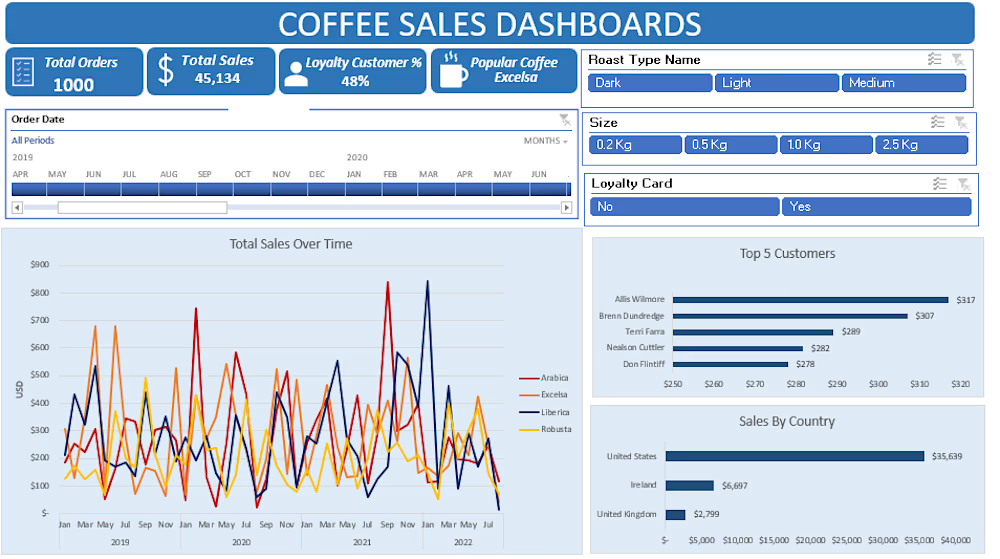

Beautiful dashboard with clear information summary