The network for creativity
Join 1.25M professional creatives like you
Connect with clients, get discovered, and run your business 100% commission-free
Creatives on Contra have earned over $150M and we are just getting started
Back to feedPost

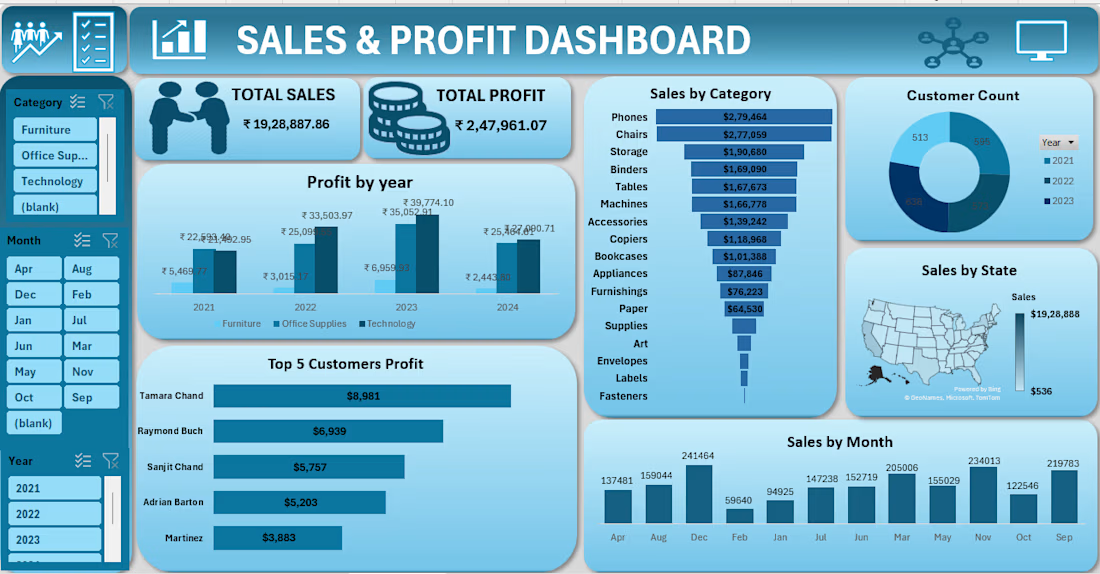
Created an interactive Excel Sales & Profit Dashboard to analyze sales performance, profitability, product trends, and regional performance. The dashboard uses Pivot Tables, formulas, and data visualization to track key business KPIs and identify trends and areas for improvement.
Tools: Microsoft Excel, Pivot Tables, Power Query, Advanced Excel


The network for creativity
Join 1.25M professional creatives like you
Connect with clients, get discovered, and run your business 100% commission-free
Creatives on Contra have earned over $150M and we are just getting started
Challenges
View all


Related posts

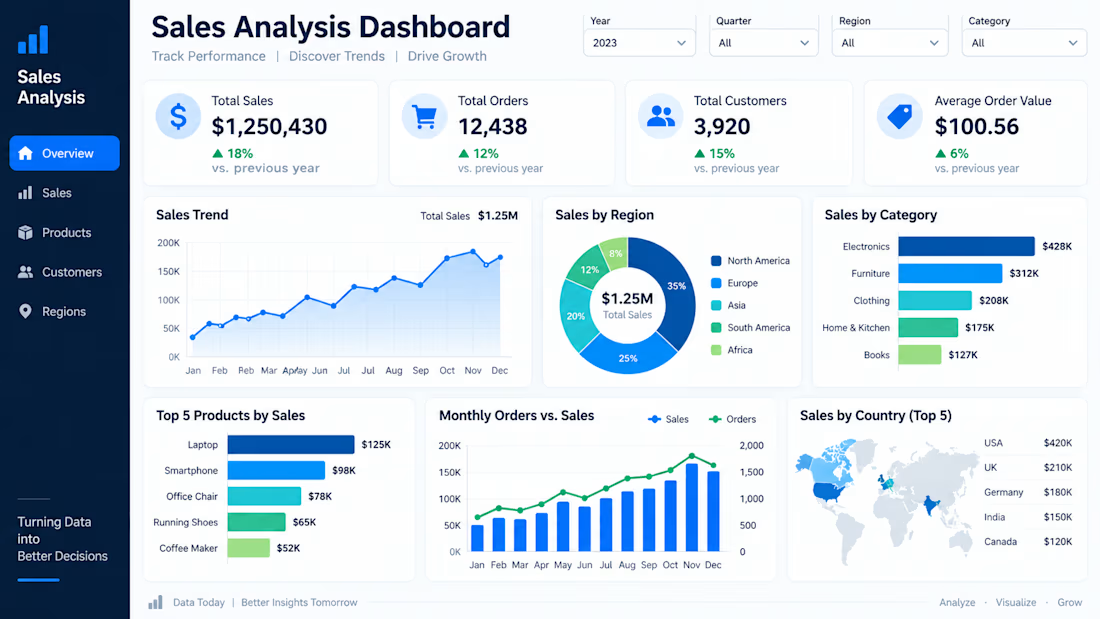
Created an interactive Sales Analysis Dashboard using Excel and Power BI to transform raw sales data into clear, actionable insights. The dashboard tracks revenue, orders, customers, regional and product performance, trends, and key KPIs, helping businesses identify patterns and make data-driven decisions.

🚨 𝗦𝘁𝗶𝗹𝗹 𝘄𝗮𝗶𝘁𝗶𝗻𝗴 𝗱𝗮𝘆𝘀 𝗳𝗼𝗿 𝘆𝗼𝘂𝗿 𝗳𝗶𝗻𝗮𝗻𝗰𝗲 𝘁𝗲𝗮𝗺 𝘁𝗼 𝗰𝗼𝗻𝘀𝗼𝗹𝗶𝗱𝗮𝘁𝗲 𝘀𝗽𝗿𝗲𝗮𝗱𝘀𝗵𝗲𝗲𝘁𝘀?
If you are making strategic decisions on delayed P&L reports, you are operating with blind spots.
When managing 𝟴-𝗳𝗶𝗴𝘂𝗿𝗲 𝗿𝗲𝘃𝗲𝗻𝘂𝗲 (€𝟭𝟳.𝟳𝟳𝗠+), static spreadsheets fail to provide the real-time cost visibility needed to protect profit margins.
Here is an executive-grade 𝗣𝗼𝘄𝗲𝗿 𝗕𝗜 𝗙𝗶𝗻𝗮𝗻𝗰𝗶𝗮𝗹 & 𝗣&𝗟 𝗦𝘁𝗮𝘁𝗲𝗺𝗲𝗻𝘁 𝗗𝗮𝘀𝗵𝗯𝗼𝗮𝗿𝗱 designed for leadership to monitor profitability, control operating expenses, and optimize cash flow in seconds.
📊 𝗞𝗘𝗬 𝗙𝗜𝗡𝗔𝗡𝗖𝗜𝗔𝗟 𝗜𝗡𝗦𝗜𝗚𝗛𝗧𝗦 & 𝗜𝗠𝗣𝗔𝗖𝗧
🔹 𝗥𝗲𝘃𝗲𝗻𝘂𝗲 𝗦𝘁𝗿𝗲𝗮𝗺 𝗩𝗶𝘀𝗶𝗯𝗶𝗹𝗶𝘁𝘆: Analyzed €𝟭𝟳.𝟳𝟳𝗠 in total top-line revenue, isolating core product sales (€𝟭𝟭.𝟳𝟳𝗠) vs. consulting services (€𝟲.𝟬𝟬𝗠).
🔹 𝗠𝗮𝗿𝗴𝗶𝗻 𝗢𝗽𝘁𝗶𝗺𝗶𝘇𝗮𝘁𝗶𝗼𝗻: Automated tracking for €𝟭𝟬.𝟱𝟵𝗠 𝗚𝗿𝗼𝘀𝘀 𝗣𝗿𝗼𝗳𝗶𝘁 (𝟱𝟵.𝟲% 𝗠𝗮𝗿𝗴𝗶𝗻) and €𝟱.𝟱𝟬𝗠 𝗡𝗲𝘁 𝗣𝗿𝗼𝗳𝗶𝘁 (𝟯𝟬.𝟵% 𝗡𝗲𝘁 𝗠𝗮𝗿𝗴𝗶𝗻).
🔹 𝗖𝗼𝘀𝘁 𝗖𝗲𝗻𝘁𝗲𝗿 𝗖𝗼𝗻𝘁𝗿𝗼𝗹: Uncovered Raw Materials (€𝟲.𝟰𝟱𝗠) as 𝟴𝟵.𝟵% of total COGS, unlocking direct vendor renegotiation targets.
🔹 𝗢𝗽𝗲𝗿𝗮𝘁𝗶𝗻𝗴 𝗘𝘴𝗽𝗲𝗻𝘀𝗲 𝗧𝗿𝗮𝗰𝗸𝗶𝗻𝗴: Monitored €𝟰.𝟱𝟳𝗠 in Opex, detailing consulting overhead (€𝟮.𝟲𝟮𝗠) and R&D spend (€𝟭.𝟰𝟯𝗠).
🔹 𝗗𝘆𝗻𝗮𝗺𝗶𝗰 𝗧𝗶𝗺𝗲 𝗜𝗻𝘁𝗲𝗹𝗹𝗶𝗴𝗲𝗻𝗰𝗲: Enabled instant drill-down across Quarters, Months, and Product Lines without relying on external paid visuals.
⚡ Automating P&L reporting eliminates manual errors, cuts review prep from days to seconds, and gives C-suite stakeholders total control over their bottom line.
💬 𝗟𝗼𝗼𝗸𝗶𝗻𝗴 𝘁𝗼 𝗮𝘂𝘁𝗼𝗺𝗮𝘁𝗲 𝘆𝗼𝘂𝗿 𝗳𝗶𝗻𝗮𝗻𝗰𝗶𝗮𝗹 𝗿𝗲𝗽𝗼𝗿𝘁𝗶𝗻𝗴 𝗼𝗿 𝗻𝗲𝗲𝗱 𝗮 𝗰𝘂𝘀𝘁𝗼𝗺 𝗣𝗼𝘄𝗲𝗿 𝗕𝗜 𝗱𝗮𝘀𝗵𝗯𝗼𝗮𝗿𝗱?
📩 𝗛𝗶𝗿𝗶𝗻𝗴 𝗮 𝗗𝗮𝘁𝗮 𝗔𝗻𝗮𝗹𝘆𝘀𝘁 / 𝗕𝗜 𝗗𝗲𝘃𝗲𝗹𝗼𝗽𝗲𝗿 for your team or project?
Send me a DM or let’s connect!
#PowerBI #FinancialAnalytics #BusinessIntelligence #ProfitAndLoss #ExecutiveDashboard #DataVisualization #FinancialModeling #DAX #CFOInsights #CorporateFinance
#BangladeshBusiness #CorporateBD #DhakaJobs #DataAnalystBD #TechBangladesh #BIFreelancer #DhakaStartups #BangladeshTech


