The network for creativity
Join 1.25M professional creatives like you
Connect with clients, get discovered, and run your business 100% commission-free
Creatives on Contra have earned over $150M and we are just getting started
Back to feedPost

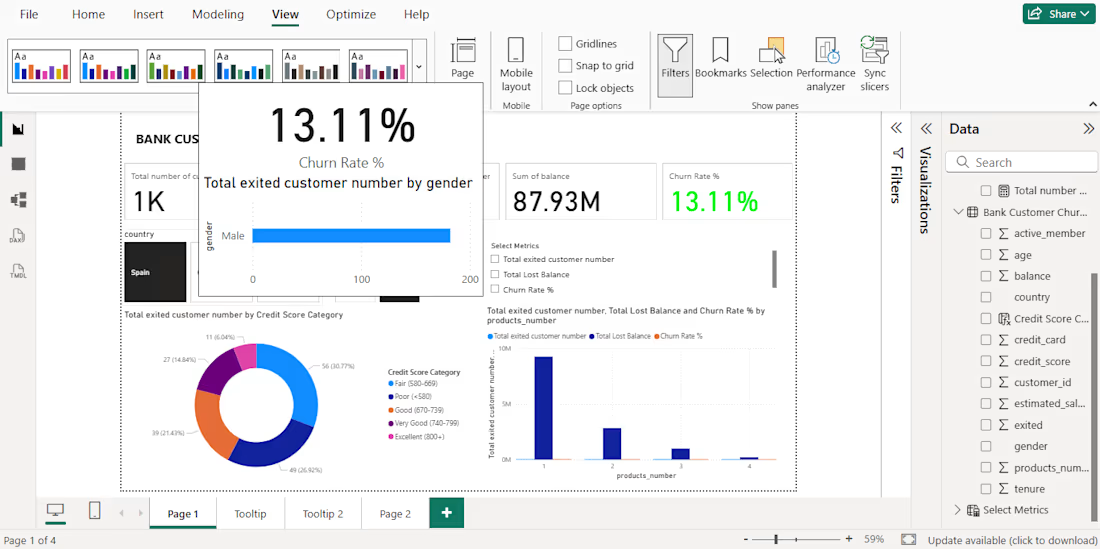
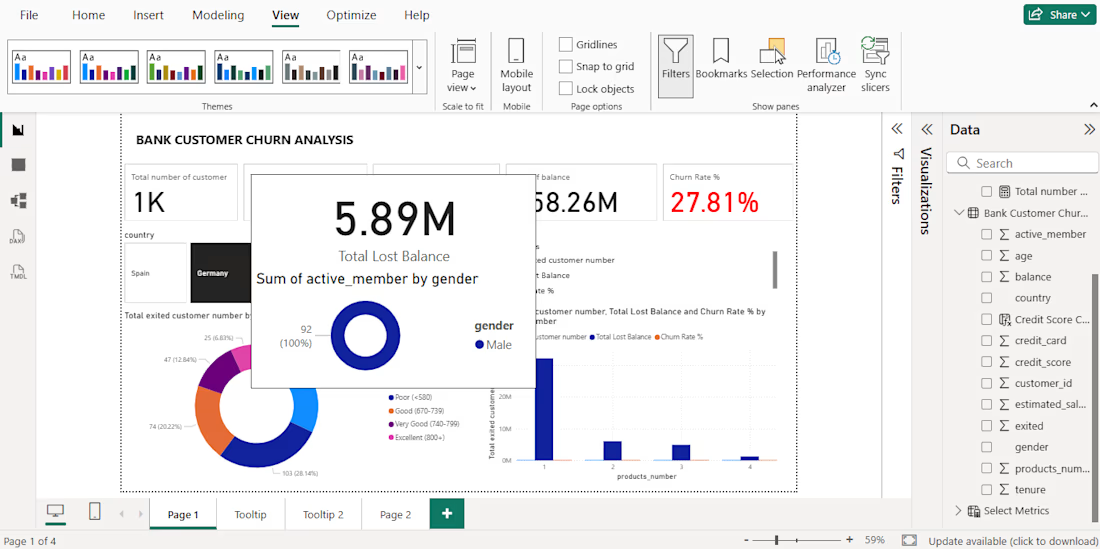
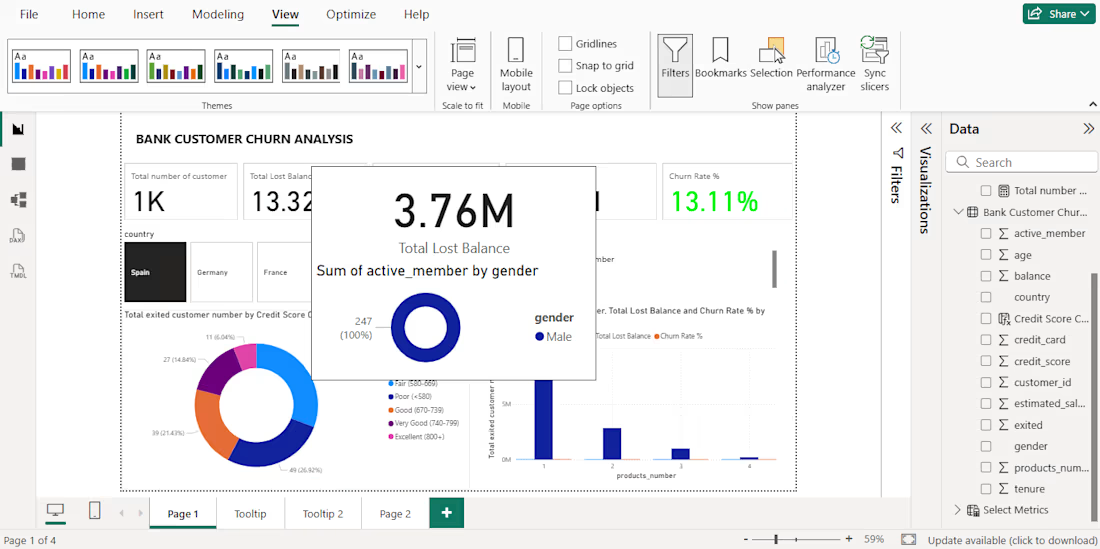
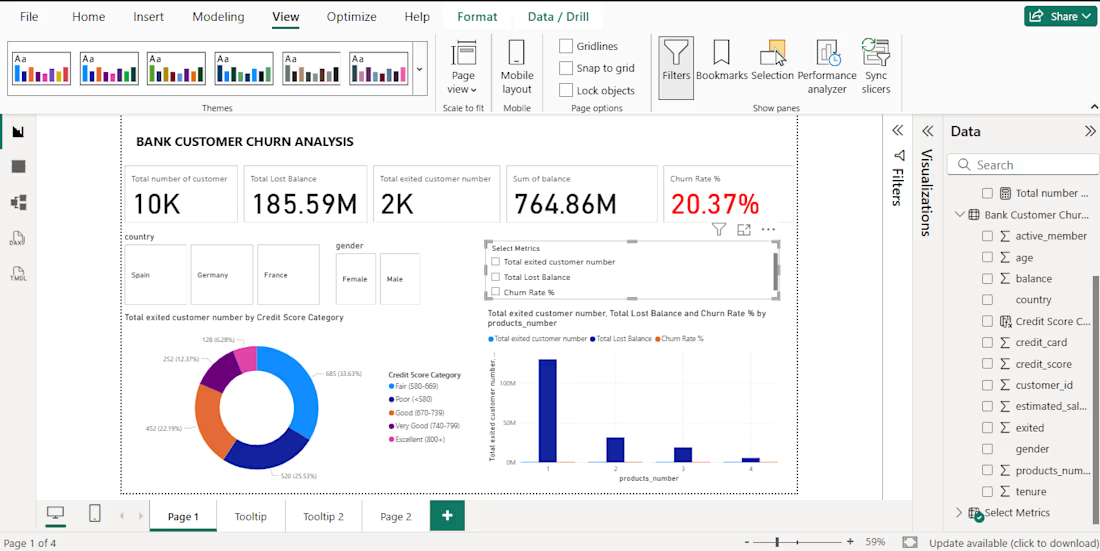
Bank Customer Churn Risk Analysis Dashboard using Power BI from Power Query to DAX function and slicers.

The network for creativity
Join 1.25M professional creatives like you
Connect with clients, get discovered, and run your business 100% commission-free
Creatives on Contra have earned over $150M and we are just getting started






Related posts

Exploring a clean, modern SaaS dashboard UI. Focused on simple layouts, smooth interactions, and a better user experience 🚀


i had to like this, it got my attention, very nice build mate.

What are your thoughts on the ongoing Power BI conversation?
In the meantime, lets have a look at this Marketing Analytics Dashboard.