The network for creativity
Join 1.25M professional creatives like you
Connect with clients, get discovered, and run your business 100% commission-free
Creatives on Contra have earned over $150M and we are just getting started
Back to feedPost

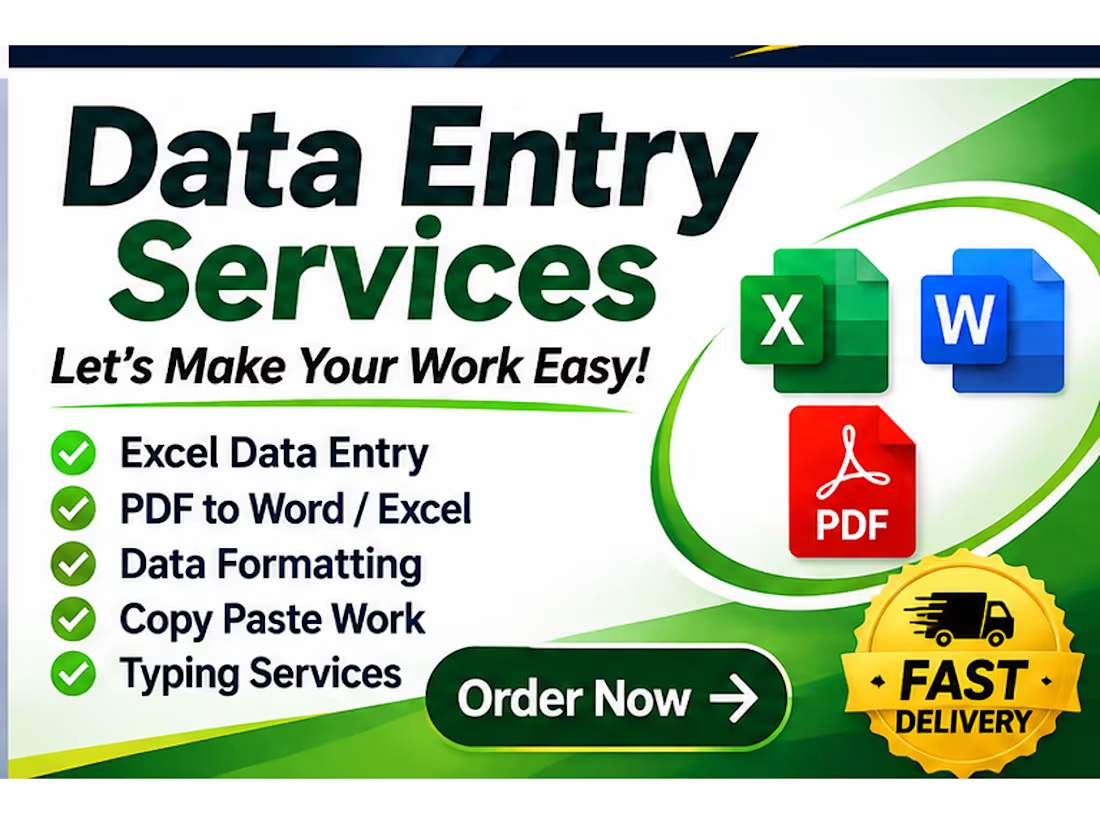
I’m currently available for Data Entry projects. I can help with Microsoft Excel, Google Sheets, PDF to Excel/Word, copy-paste, data cleaning, and web research.

The network for creativity
Join 1.25M professional creatives like you
Connect with clients, get discovered, and run your business 100% commission-free
Creatives on Contra have earned over $150M and we are just getting started



Related posts

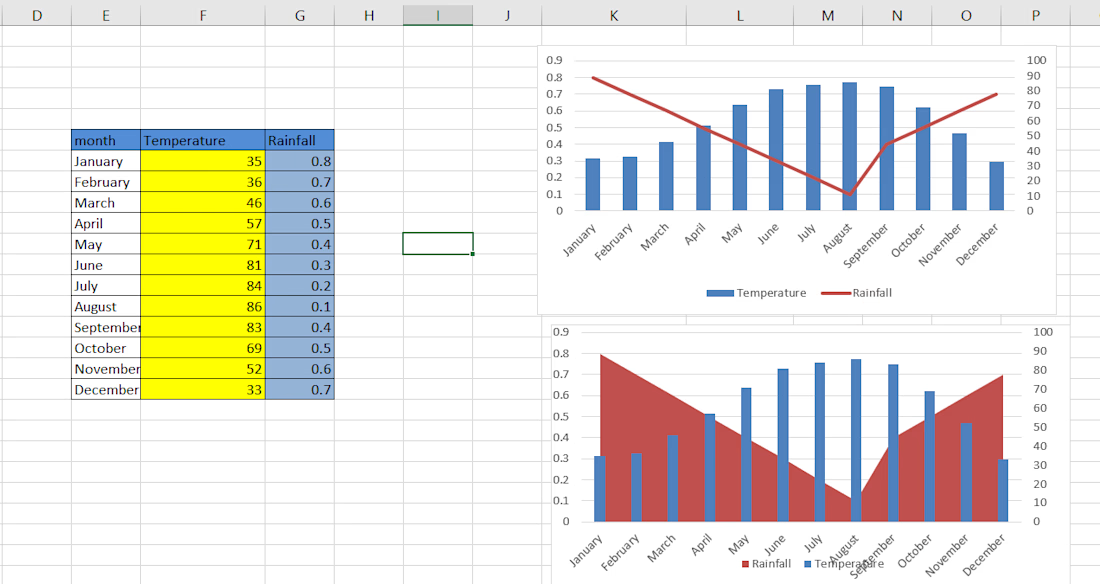
🌦️ Rainfall vs. Temperature: What Do the Charts Reveal?
Here's one of my recent Excel Data Visualization projects, where I explored the relationship between Monthly Temperature and Rainfall through interactive-style chart visualizations.
📊 What I worked on:
Organized and structured monthly temperature and rainfall data.
Created a Combination Chart using Column and Line Charts.
Designed an Area and Column Chart for visual comparison.
Used a secondary axis to represent two different measurement scales.
Presented seasonal patterns in a simple and visually understandable format.
Key Learning: Data becomes more meaningful when it's presented visually. The right visualization makes trends, patterns, and comparisons easier to understand.
🛠️ Tool Used: Microsoft Excel
📈 Skills: Data Visualization | Combo Charts | Secondary Axis | Data Presentation | Excel
This is a small project, but every project is a step towards becoming better at turning data into insights!


Data Entry, Excel, PDF to Word/Excel Conversion, Copy Paste, Web Research and Data Collection.


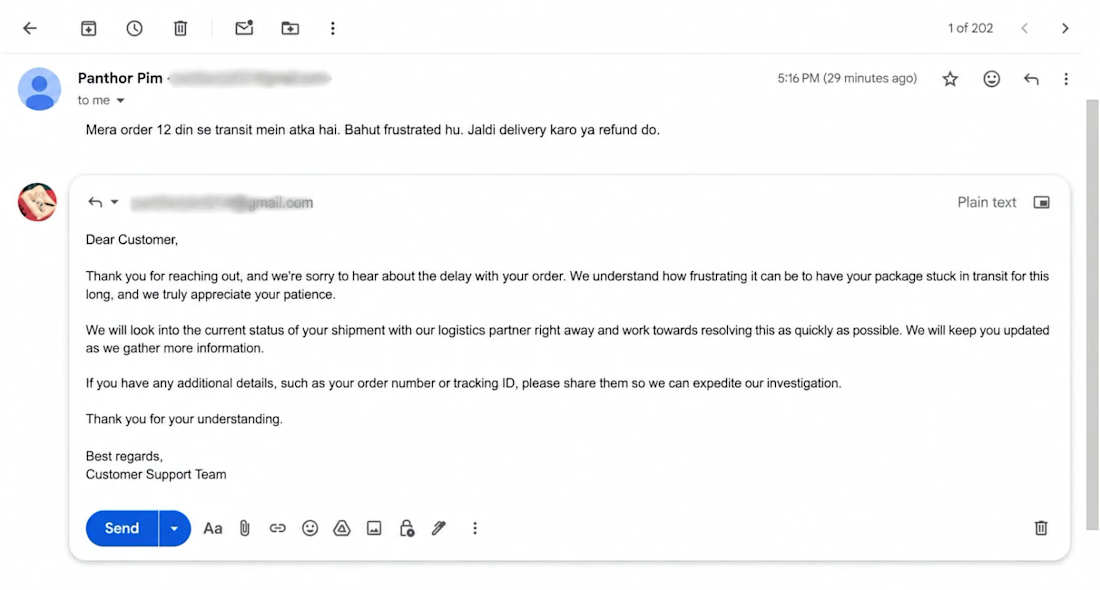
Built an AI automation that handles customer complaint emails.
Claude detects the complaint and tone, drafts a polite Gmail reply, and logs every case in Google Sheets. All in about 20 seconds.
Built with n8n. Would love your feedback! 🙌