The network for creativity
Join 1.25M professional creatives like you
Connect with clients, get discovered, and run your business 100% commission-free
Creatives on Contra have earned over $150M and we are just getting started
Back to feedPost

How I engineered a 3,675% audience growth surge in 7 days. This project showcases the transition from a viral market signal to a sustained global scaling strategy using psychographic profiling and time-zone arbitrage. High-velocity results meet rigorous operational logic.
Growth HackerMarketing AnalyticsGoogle AnalyticsMicrosoft ExcelFacebook Business ManagerBusiness Operations


Impressive results. I like how you validated the signal before scaling — that transition from spike to sustainable growth is where most experiments fail.
The network for creativity
Join 1.25M professional creatives like you
Connect with clients, get discovered, and run your business 100% commission-free
Creatives on Contra have earned over $150M and we are just getting started
Related posts


SEO, AEO & GEO Content Strategy | Search Visibility That Drives Growth
Search is evolving, and content needs to do more than rank on Google. It needs to answer questions, build authority, and make brands discoverable across traditional search engines and AI-powered platforms.
This portfolio showcases my approach to creating search-focused content that combines Search Engine Optimization (SEO), Answer Engine Optimization (AEO), and Generative Engine Optimization (GEO) to help businesses strengthen their online visibility.
What I focus on:
SEO: Keyword research, search intent, on-page optimization, and content structured to improve organic visibility.
AEO: Clear, answer-focused content designed to address user questions and improve eligibility for featured snippets and answer-based search results.
GEO: Helpful, authoritative, well-structured content designed to improve a brand’s chances of being referenced in AI-generated responses.
Content Strategy: Creating valuable, reader-first content that aligns with business goals, audience needs, and search opportunities.
My goal is to create content that connects search visibility with real business outcomes—not just rankings and traffic, but relevance, authority, and opportunities for growth.
Search Engine OptimizationSEO Content Managment Web DesignGoogle AnalyticsGoogle Search ConsoleSEMrush


I am also SEO, SGE, GEO specialist but what's AEO?

Project Overview:
A high-retention, faceless short-form video created for educational psychology and relationship content.
What I Did:
Script-to-Screen Production: Developed and paced the narrative flow based on the Gottman Institute's "Love Map" framework.
Visuals & Animation: Designed aesthetic, emotionally resonant visual framing and AI-assisted art assets.
Editing & Typography: Applied dynamic, highly readable kinetic captions to maximize viewer retention and engagement on Instagram Reels and TikTok.
Looking for similar high-converting faceless videos or long-form content repurposing for your brand? Check out my service packages below!


The truth about marriage actually

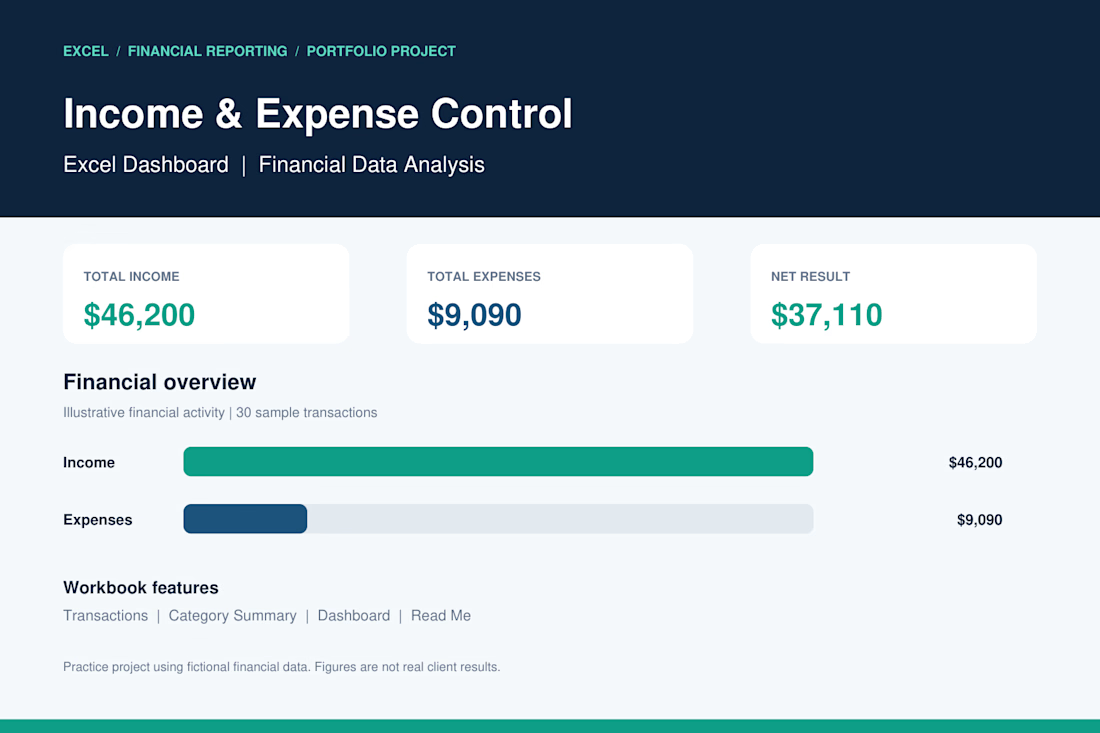
Income & Expense Control | Excel Dashboard
I developed a professional Excel dashboard as a portfolio practice project to demonstrate my skills in financial data management, income and expense tracking, and business reporting.
Project Features:
Automated income and expense calculations.
Financial dashboard with key performance indicators (KPIs).
Transaction tracking and organization.
Expense analysis by category.
Financial charts and visual reporting.
Net income calculation.
Project Results (Sample Data):
Total Income: $46,200
Total Expenses: $9,090
Net Result: $37,110
Tools: Microsoft Excel
Skills: Data Analysis, Accounting, Financial Reporting, Data Entry.
This project demonstrates my ability to organize financial records, analyze business performance, and create clear financial reports using Microsoft Excel.
Note: This is a portfolio demonstration using fictional financial data.

Great work 👏🏻