The network for creativity
Join 1.25M professional creatives like you
Connect with clients, get discovered, and run your business 100% commission-free
Creatives on Contra have earned over $150M and we are just getting started
Back to feedPost

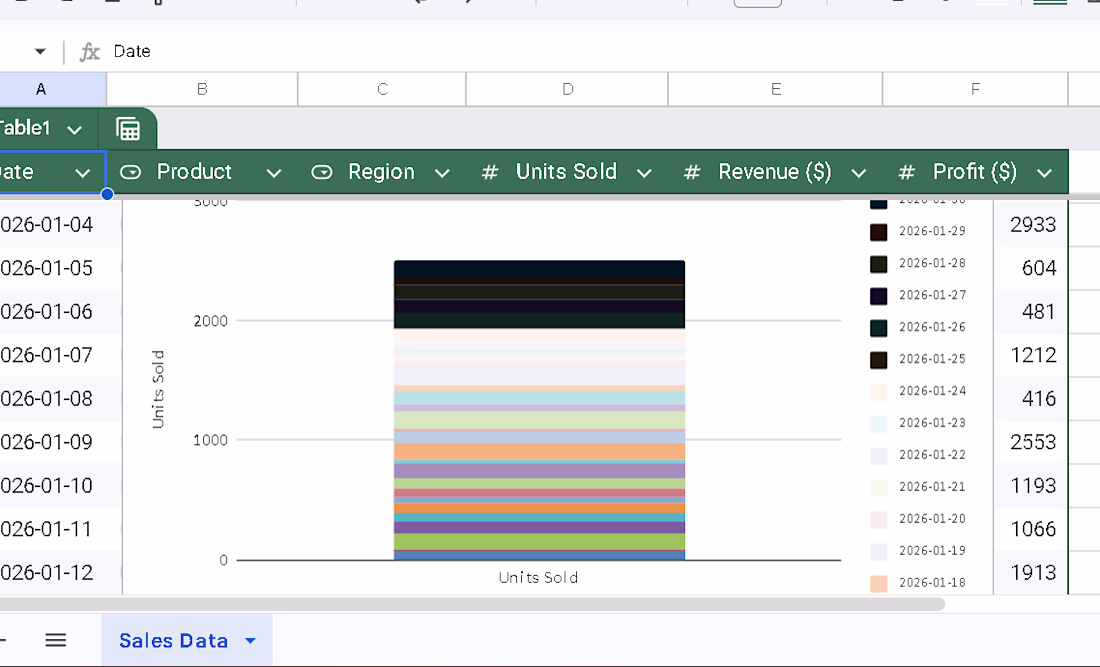
This project involved creating a structured sales dataset and developing an interactive Excel dashboard to visualize business performance. Raw sales data was organized into clean tables and analyzed to track revenue trends, product performance, and regional sales distribution.
Using Excel tools, charts were created to present key insights, including monthly revenue trends, product-wise sales comparison, and revenue contribution by region. A separate dashboard sheet was built to combine these visual reports into a clear and professional layout for quick business decision-making.
The final output allows businesses to easily monitor performance, identify top-selling products, and analyze revenue distribution without manually reviewing raw data.


The network for creativity
Join 1.25M professional creatives like you
Connect with clients, get discovered, and run your business 100% commission-free
Creatives on Contra have earned over $150M and we are just getting started
Related posts


Clean 🙌

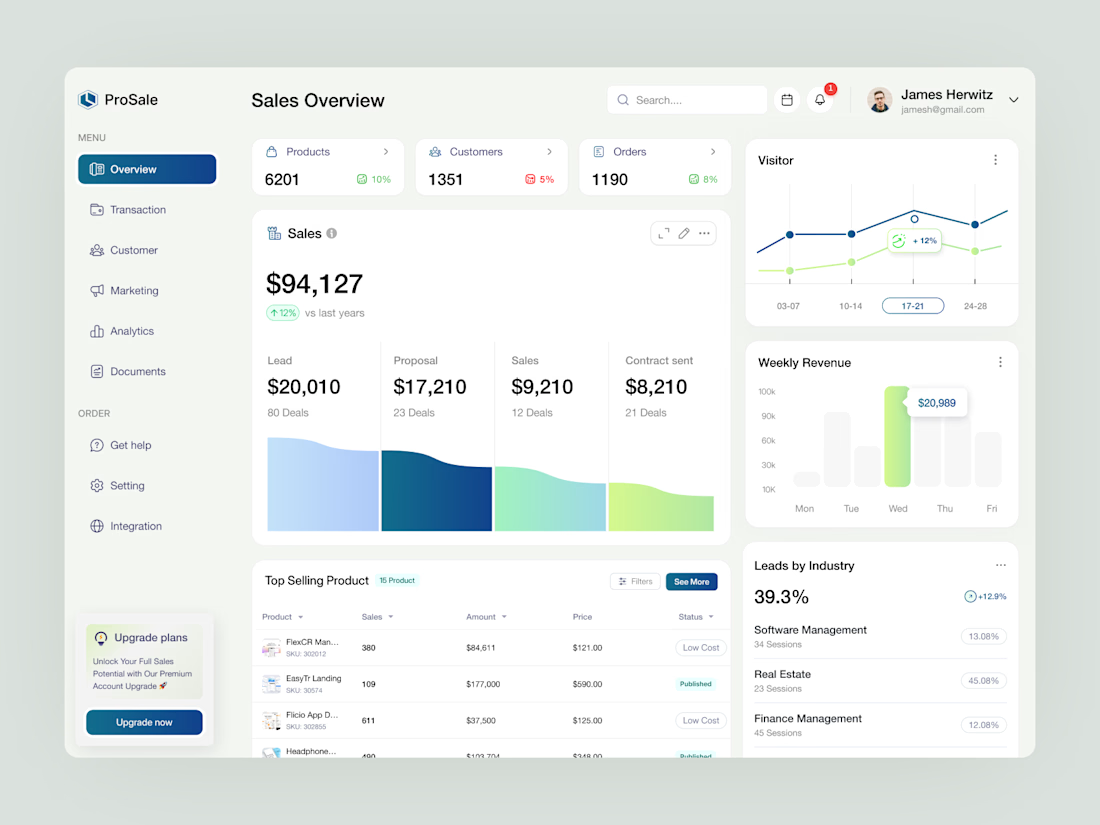
ProSale - CRM Sales Overview Dashboard Design
This ProSale Analytics Dashboard provides a comprehensive and intuitive view of key sales metrics, designed to help businesses make data-driven decisions. The goal was to create a clean, modern, and highly functional SaaS dashboard design that's both aesthetically pleasing and easy to navigate.
Designed for CRM, eCommerce, and B2B platforms, this dashboard streamlines decision-making and maximizes productivity. The harmonious color palette and minimalistic interface focus attention where it matters most, optimizing user experience for both desktop and tablet users.


Good work


Trending


Notion
Notion isn’t just where you work, it’s starting to work for you. What agents are you building?
portfolioreview
The best portfolios tell a story, not just show a grid. Share yours for feedback.
brandguidelines
Brand guidelines are becoming living systems, not static documents. What are you building for your clients?
aivideo
AI video tools are moving at warp speed. Which ones are you experimenting with?
freelancerlife
Freelancer life is wins, pivots, and everything in between. What’s yours right now?