The network for creativity
Join 1.25M professional creatives like you
Connect with clients, get discovered, and run your business 100% commission-free
Creatives on Contra have earned over $150M and we are just getting started
Back to feedPost
Professional Power BI Dashboard Design for Business Data Analysis
👨💻 What I Do
I am a Power BI Dashboard Designer who transforms your raw, unorganized business data into stunning, interactive, and professional dashboards. I build multi-page dark-themed dashboards with KPI cards, dynamic charts, slicers, and filters that give you a complete 360° view of your business performance — all in one place.
Whether you have sales data, ecommerce orders, product performance, or financial records — I will turn it into a beautiful visual story that is easy to understand and act upon.
❌ What Is The Problem Here
Most business owners and managers are drowning in raw Excel sheets and CSV files with thousands of rows of data. The real problems are:
❌ You cannot see your business performance at a glance
❌ Important insights are hidden inside messy spreadsheets
❌ You waste hours manually calculating sales, profit and orders
❌ Your reports look boring and unprofessional
❌ You have no interactive filters to explore your data easily
❌ Decision making becomes slow and guesswork-based
❌ No proper trend analysis for daily, monthly or yearly performance
This is exactly where most businesses lose money and opportunities — because they simply cannot read their own data properly.
✅ What I Fixed
I solve all of these problems by building you a fully interactive Power BI dashboard that includes:
✔ KPI Cards — See Total Sales, Profit, Orders and Quantity at one glance
✔ Bar Charts — Compare profit and performance across all products instantly
✔ Donut Chart — Understand your payment mode distribution clearly
✔ Area & Line Charts — Track yearly and daily order trends by product
✔ Slicers & Filters — Filter your entire dashboard by product, category or payment mode in one click
✔ Multi-Page Layout — Separate pages for Overview, Trends and Category analysis
✔ Dark Professional Theme — A dashboard that looks premium and impressive
✔ Sub-Category Analysis — Drill down into profit and amount by sub-category
No more confusion. No more manual calculations. Just clear, beautiful, actionable insights at your fingertips.
🏆 Why I Am Best For You
There are hundreds of dashboard designers out there — here is why you should choose me:
⭐ I understand your data — I do not just make pretty charts. I study your data first and build a dashboard that actually makes sense for your business.
⭐ Dark theme specialist — My dashboards have a unique, premium dark theme design that stands out from generic white dashboards everyone else delivers.
⭐ Fast & reliable — I deliver on time, every time. Starter in 7 days, Standard in 3 days and Advanced in just 1 day.
⭐ Full communication — I keep you updated at every step. No ghosting, no delays, no surprises.
⭐ Revision guarantee — I do not stop until you are 100% satisfied with the final result.
⭐ Clean file delivery — You get a professionally organized .pbix file that is easy to use and update anytime.
⭐ Affordable pricing — Starting from just $5, you get a professional dashboard that would cost hundreds elsewhere.
⭐ Proven results — My dashboards have helped businesses track performance, identify trends and make faster and smarter decisions.
📩 Ready To Get Started?
Stop wasting time in Excel sheets and start making data-driven decisions with a professional Power BI dashboard.
Message me now — tell me about your data and I will get started right away! 🚀
The network for creativity
Join 1.25M professional creatives like you
Connect with clients, get discovered, and run your business 100% commission-free
Creatives on Contra have earned over $150M and we are just getting started
Related posts
A little throwback to some Dashboard/Data work I was doing for Myota a while back! Still love the side nav
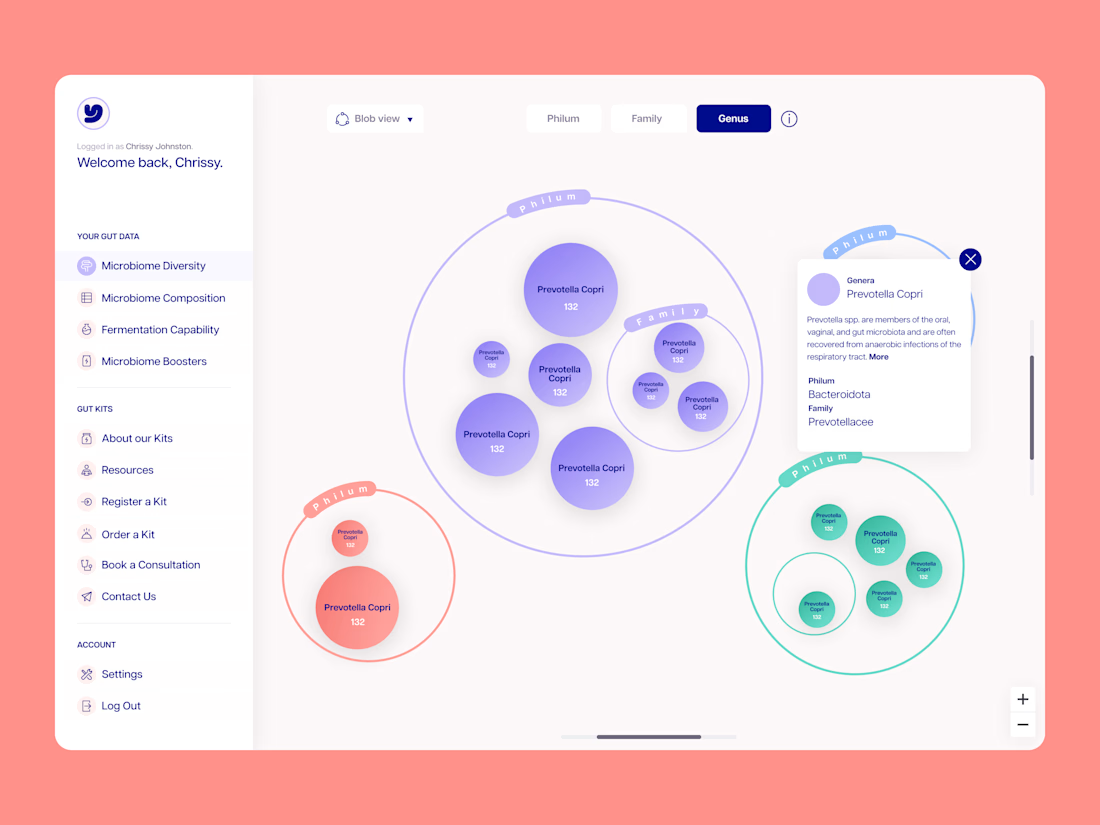
Good work
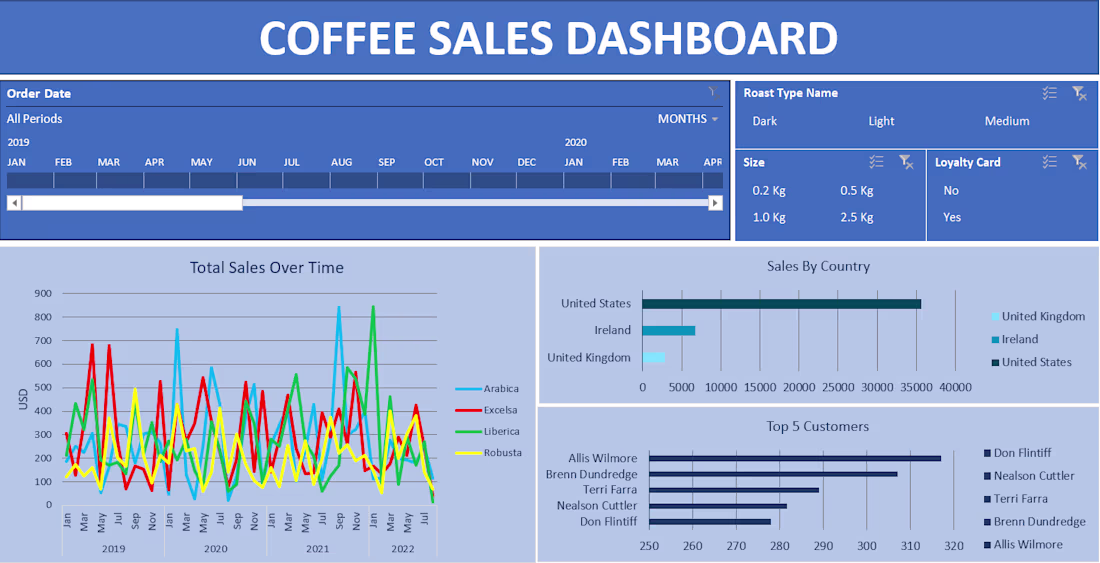
Coffee Sales Dashboard built using Excel to analyze sales performance, customer trends, and product insights.
The dashboard includes filters, interactive charts, and key metrics like total sales, profit, and top customers.
This project helps in making data-driven decisions by transforming raw data into clear visual insights.
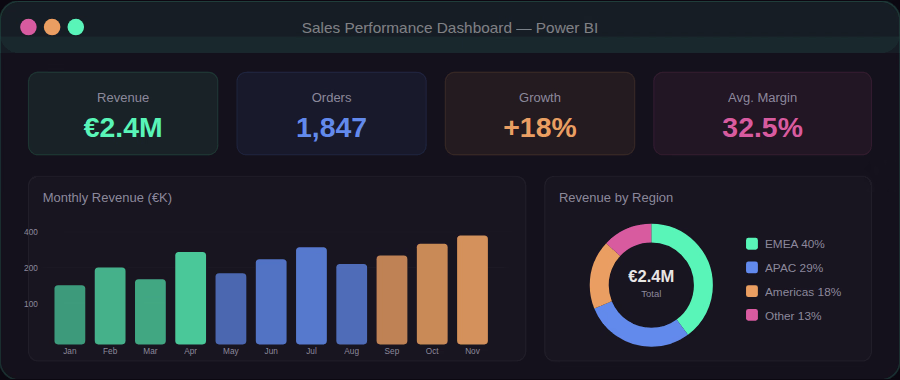
d Built an interactive Power BI dashboard tracking revenue, orders, and regional performance across EMEA, APAC, and Americas. Automated monthly reporting that previously took hours of manual spreadsheet work.
Trending
Claude
Claude has entered the design space. How are you using Claude Design?
Contra University
Learn from expert creatives how to earn more using next-gen AI tools.
creativeaiflow
Creative AI workflows are evolving. What tools do you use, and what are their strengths and weaknesses?
portfolioreview
The best portfolios tell a story, not just show a grid. Share yours for feedback.
freelancerlife
Freelancer life is wins, pivots, and everything in between. What’s yours right now?