The network for creativity
Join 1.25M professional creatives like you
Connect with clients, get discovered, and run your business 100% commission-free
Creatives on Contra have earned over $150M and we are just getting started
Back to feedPost
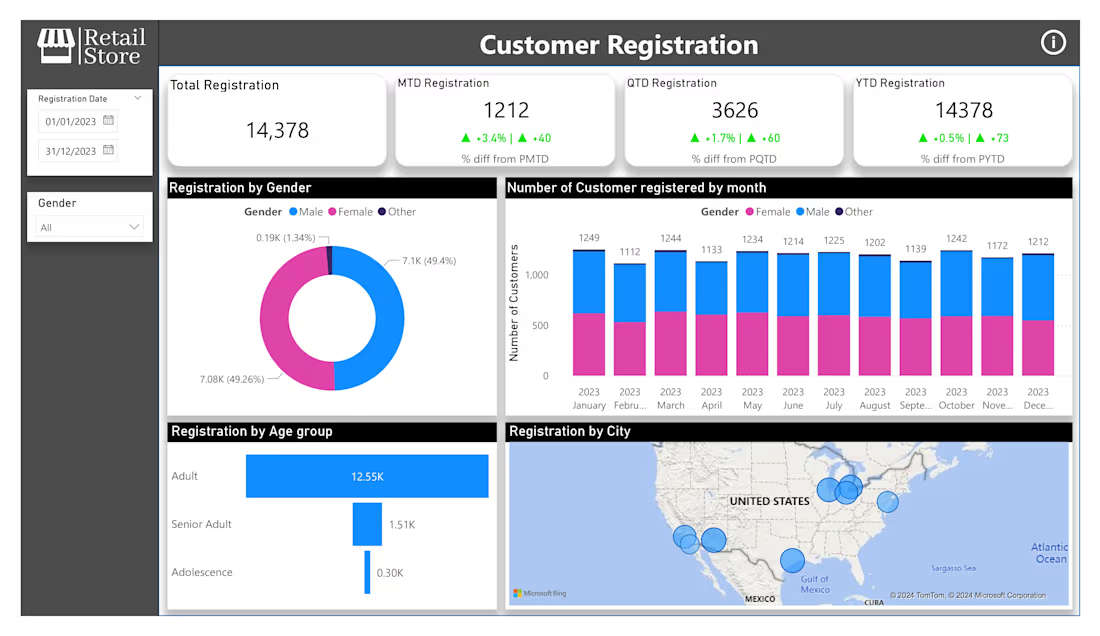
🚀 Part One of My Retail Store Analysis Dashboard in Power BI: User Registration🚀
I’m thrilled to share the first part of my Retail Store Analysis Dashboard. In this initial phase, I’ve concentrated on analyzing user registration data, laying the groundwork for understanding our customer base and how it’s evolving over time.
Here’s what I’ve covered:
Registration Trends Over Time, and Demographic Breakdown
🛠 Tools Used
Power BI has been instrumental in bringing these insights to life. Its powerful data visualization capabilities allow for a deep dive into the numbers, making it easier to uncover trends and opportunities.
👉 What’s Next?
In Part Two, I’ll be exploring customer behavior post-registration, focusing on purchase patterns, and how these factors influence overall store performance.
The network for creativity
Join 1.25M professional creatives like you
Connect with clients, get discovered, and run your business 100% commission-free
Creatives on Contra have earned over $150M and we are just getting started
Challenges
View allTrending
Claude
Claude has entered the design space. How are you using Claude Design?
Contra University
Learn from expert creatives how to earn more using next-gen AI tools.
creativeaiflow
Creative AI workflows are evolving. What tools do you use, and what are their strengths and weaknesses?
portfolioreview
The best portfolios tell a story, not just show a grid. Share yours for feedback.
freelancerlife
Freelancer life is wins, pivots, and everything in between. What’s yours right now?