The network for creativity
Join 1.25M professional creatives like you
Connect with clients, get discovered, and run your business 100% commission-free
Creatives on Contra have earned over $150M and we are just getting started
Back to feedPost
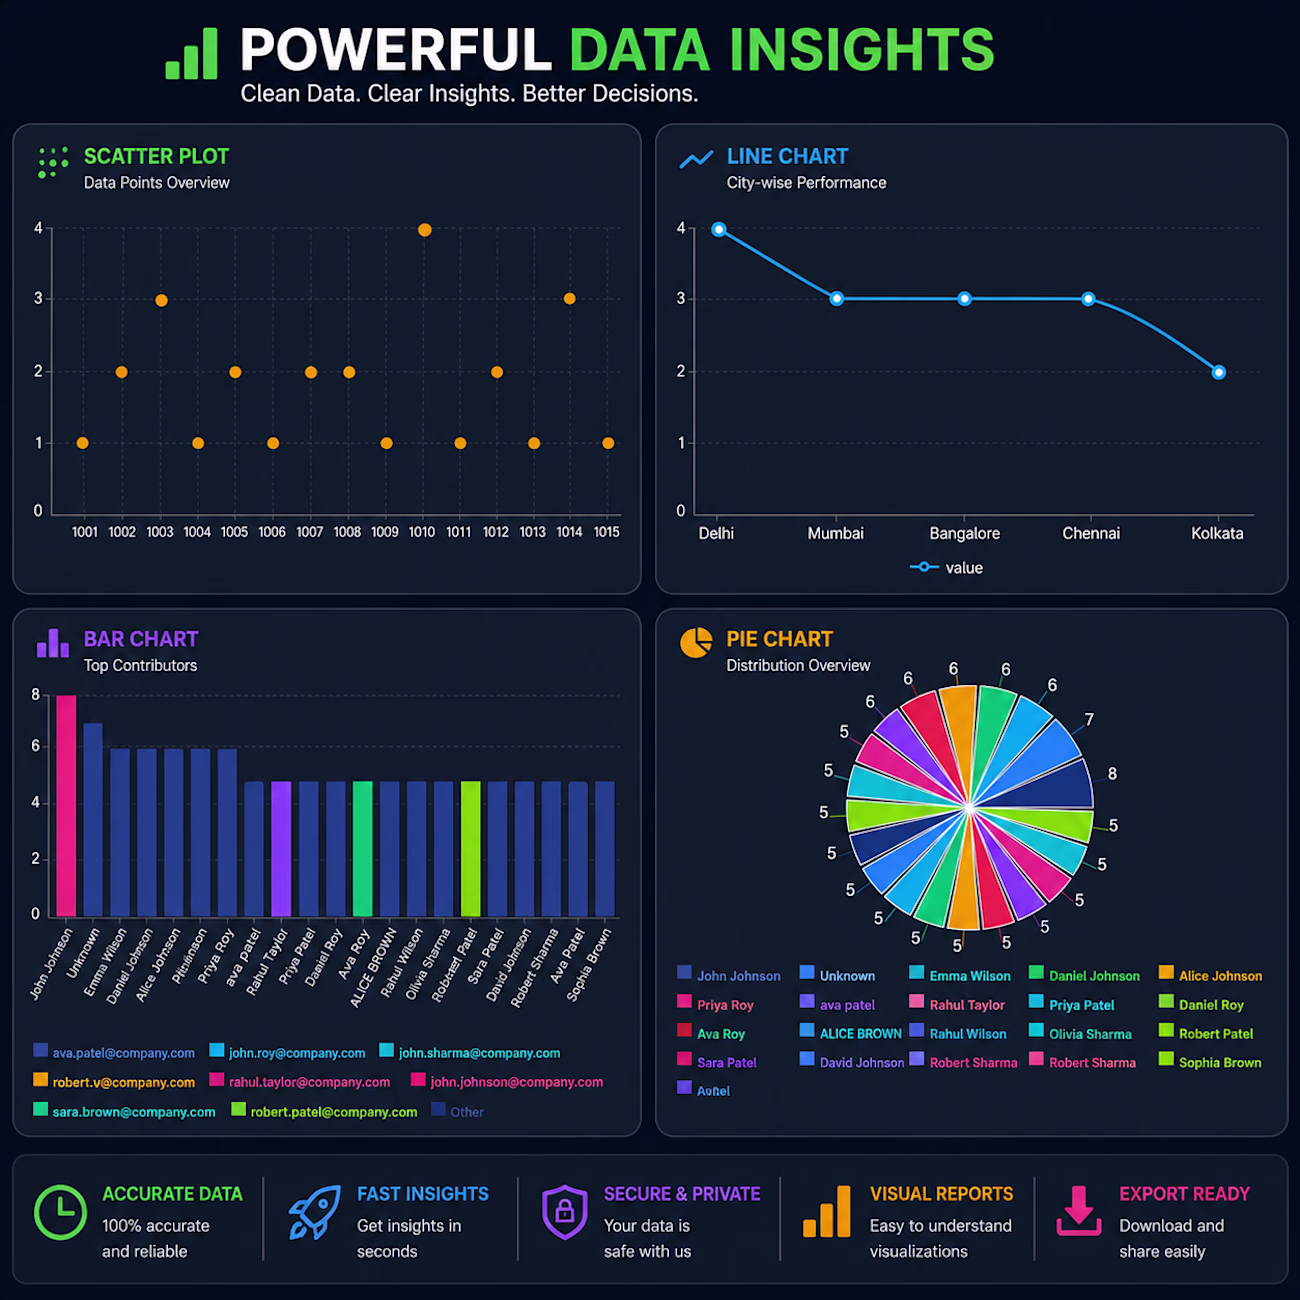
This dashboard showcases my ability to transform raw business data into clear, interactive visualizations. It combines multiple chart types—including scatter, line, bar, and pie charts—to reveal trends, comparisons, and key performance insights. Designed with a modern, user-friendly interface, it helps businesses analyze data faster, make informed decisions, and present information in a professional and visually engaging way
The network for creativity
Join 1.25M professional creatives like you
Connect with clients, get discovered, and run your business 100% commission-free
Creatives on Contra have earned over $150M and we are just getting started
Related posts
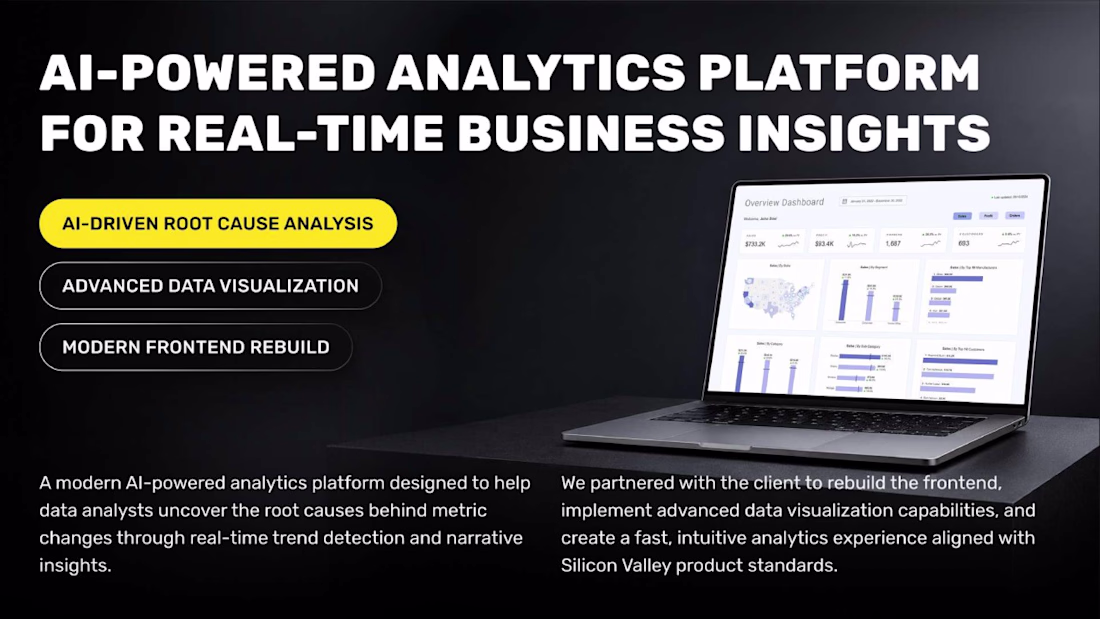
A founder from Silicon Valley came to us with a product that was already working.
The AI logic was solid. The backend did what it was supposed to. DataScoop could analyze metric changes, find the root causes and explain them in plain language - which, honestly, is genuinely hard to build.
The problem was everything the user actually saw.
The interface hadn't kept up with the product. There were Figma designs ready, a completely new visual direction, but no one had translated them into a working frontend yet. The existing code wasn't built to carry them. And the data visualization layer, the part that makes analytics actually readable, needed to be rebuilt from scratch.
So the ask was clear on the surface: rebuild the frontend, implement the new design, make it fast.
In practice, it was more nuanced than that.
Complex data files needed to be parsed and turned into charts that told a story, not just displayed numbers. Performance had to hold up so that insights landed in seconds, not after a loading spinner that made you forget what you were looking at. And all of it had to feel like it belonged together: the AI output, the visualizations, the interface, the Slack and email delivery.
We rebuilt the frontend in React.js and TypeScript, applied strict code quality standards from the start and worked through the Figma designs screen by screen, not just implementing them, but pressure-testing how they behaved with real data.
The hardest part wasn't any single technical problem. It was maintaining coherence, making sure that as the pieces came together, they felt like one product, not a patchwork.
The result is a platform where a data analyst can open it, see a metric move, and understand why, in plain language, in seconds, delivered wherever they actually work.
That's the version DataScoop's users have now.
Check it out
Great job
How are you with understanding your blood test results?
Aura is a personal health dashboard 📊 that organises your medical test results into a plain-language insights. You can also chat with Aura to go deeper on anything that concerns you.
Built on Bubble AI generated foundation and taken the rest of the way by hand:
→ Started with a single prompt to Bubble AI, shaped by Claude;
→ Bubble AI generated the foundation: pages, data structure, and UI;
→ Cleaned up the structure into a working app;
→ Redesigned every screen into a soft, light experience.
🎬 See full process walkthrough and comparison between Bubble's initial output and my design in the comments.
🔗 Try Aura
Process walkthrough:
━━━━━━━━━━━━━━━━━━━━━━
🚀 GRIDSCORE - The Trust Layer for Freelancers
━━━━━━━━━━━━━━━━━━━━━━
📂 CATEGORY
Dashboard + Social/Community
━━━━━━━━━━━━━━━━━━━━━━
💡 WHAT IS GRIDSCORE?
━━━━━━━━━━━━━━━━━━━━━━
GridScore is a client intelligence platform built for freelancers, consultants, agencies, and independent professionals.
It helps freelancers evaluate client quality, monitor relationship health, identify risks early, and make smarter business decisions using analytics, AI-powered insights, and community intelligence.
Think of it as a credit score system for freelance clients.
━━━━━━━━━━━━━━━━━━━━━━
⚠️ THE PROBLEM
━━━━━━━━━━━━━━━━━━━━━━
Freelancers frequently face challenges such as:
• Late payments
• Poor communication
• Scope creep
• Unpredictable client behavior
• Limited information before accepting projects
Unlike banks that use credit scores to assess risk, freelancers typically make decisions with little or no data.
━━━━━━━━━━━━━━━━━━━━━━
✅ THE SOLUTION
━━━━━━━━━━━━━━━━━━━━━━
GridScore provides a centralized platform where Freelancers can:
• Track client relationships
• Measure client health through a scoring system.
• Identify engagement risks
• Monitor payment behavior
• Access community-driven intelligence
• Make data-informed decisions
━━━━━━━━━━━━━━━━━━━━━━
⭐ KEY FEATURES
━━━━━━━━━━━━━━━━━━━━━━
📊 Client Health Scoring
Each client receives a GridScore (0–100) calculated using:
• Payment Speed
• Communication Responsiveness
• Scope Creep Incidents
• Repeat Projects
Scores are automatically translated into letter grades and risk levels.
──────────────────────
📈 Analytics Dashboard
A centralized dashboard featuring:
• Total Clients
• Average Health Score
• Revenue Metrics
• On-Time Payment Rates
• Repeat Project Counts
• Risk Indicators
Interactive charts help users quickly identify trends and opportunities.
──────────────────────
👥 Client Management
Users can:
• Create client profiles
• Track project history
• Monitor engagement metrics
• Manage client records
• Analyze relationship performance
──────────────────────
🤖 AI-Powered Insights
GridScore generates intelligent recommendations including:
• Late payment warnings
• Communication trend analysis
• Scope creep alerts
• Client health summaries
• High-value client identification
──────────────────────
🌐 Community Intelligence
Freelancers can anonymously contribute:
• Client Reviews
• Payment Reliability Ratings
• Communication Ratings
• Scope Creep Experiences
• Work-Again Recommendations
Submissions are aggregated into company reputation scores while preserving contributor anonymity.
━━━━━━━━━━━━━━━━━━━━━━
🛠️ HOW IT WAS BUILT
━━━━━━━━━━━━━━━━━━━━━━
GridScore was built using Bubble and started from a Bubble AI-generated foundation.
The initial AI-generated application established the core structure of the platform.
From that foundation, the application was expanded with:
✓ Custom Client Health Scoring
✓ Analytics Dashboards & Visualizations
✓ AI Insight Features
✓ Community Intelligence System
✓ Client Management Workflows
✓ Modern SaaS User Experience
The final product evolved significantly beyond the initial AI-generated baseline while retaining Bubble AI as the starting point.
━━━━━━━━━━━━━━━━━━━━━━
🌍 WHY IT MATTERS
━━━━━━━━━━━━━━━━━━━━━━
Freelancers are businesses, yet many lack tools for evaluating client risk and relationship quality.
GridScore provides a data-driven approach to client management, helping freelancers reduce uncertainty, protect their income, and make more informed decisions.
The long-term vision is to become the trust and reputation layer for freelance work worldwide.
━━━━━━━━━━━━━━━━━━━━━━
Live Demo Link: Link to the Demo on Bubble
━━━━━━━━━━━━━━━━━━━━━━
This solves a real problem in the freelance space.
Trending
Claude
Claude has entered the design space. How are you using Claude Design?
Contra University
Learn from expert creatives how to earn more using next-gen AI tools.
MagicPath
The canvas is infinite, and exploration is becoming the workflow. How are you using MagicPath?
creativeaiflow
Creative AI workflows are evolving. What tools do you use, and what are their strengths and weaknesses?
freelancerlife
Freelancer life is wins, pivots, and everything in between. What’s yours right now?