The network for creativity
Join 1.25M professional creatives like you
Connect with clients, get discovered, and run your business 100% commission-free
Creatives on Contra have earned over $150M and we are just getting started
Back to feedPost
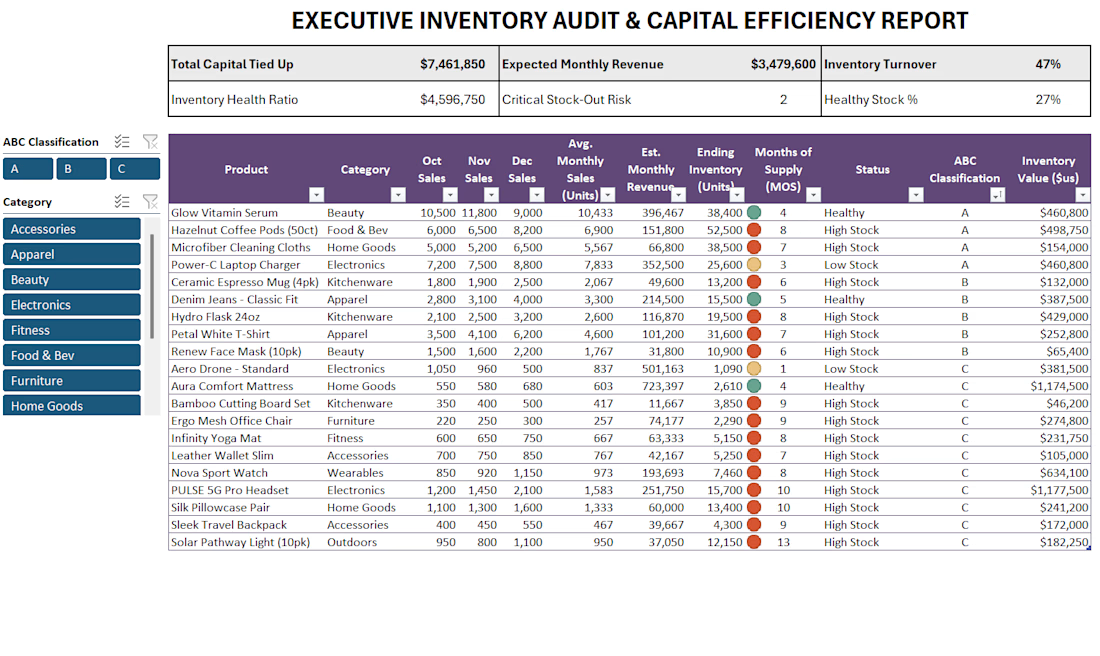
Finding Powerful Insights in a Simple Report
You don’t need complex software to see the "hidden" story behind the numbers. Using standard Excel formulas (VLOOKUP, SUMIF, AVG), I turned a messy SKU list into a clear Inventory Report that reveals exactly where money is being lost.
Three key insights from this Inventory Report:
⚠️ The Capital Trap: We have $7.4M tied up in stock, but $4.5M of that is "frozen" in slow-moving items.
🚨 Revenue at Risk: We’re risking $350K in monthly sales because we're stocking the wrong items.
📊 The Efficiency Gap: Only 27% of our inventory is "Healthy." The rest is either dangerously low or excessively high.
This report is about moving from "guessing" to "knowing." By cleaning the data and adding simple Slicers, we created a tool that protects revenue and optimizes Cash Flow.
Business AdministrationdataanalyticsinventorymanagementMicrosoft ExcelData AnalysisBusiness Analysis
The network for creativity
Join 1.25M professional creatives like you
Connect with clients, get discovered, and run your business 100% commission-free
Creatives on Contra have earned over $150M and we are just getting started
Challenges
View allTrending
Claude
Claude has entered the design space. How are you using Claude Design?
Contra University
Learn from expert creatives how to earn more using next-gen AI tools.
fifaworldcup2026
The World Cup is here and the whole world's watching. How are you designing for the world stage?
creativeaiflow
Creative AI workflows are evolving. What tools do you use, and what are their strengths and weaknesses?
freelancerlife
Freelancer life is wins, pivots, and everything in between. What’s yours right now?