The network for creativity
Join 1.25M professional creatives like you
Connect with clients, get discovered, and run your business 100% commission-free
Creatives on Contra have earned over $150M and we are just getting started
Back to feedPost
Day 4: We added live occupancy % + a global world map view to Bustix.
The upgrade:
→ Live Occupancy: See exact % of seats filled in real-time
→ World Map View: Zoom out to see all active buses across cities
→ Smart indicators: Green (<50%), Yellow (50-80%), Red (>80% full)
What's actually done today:
✅ Live occupancy percentage display (mock data for testing)
✅ World map container with global view toggle
✅ Color-coded capacity indicators (green/yellow/red)
✅ Smooth zoom transitions between city + world view
✅ Occupancy sync with bus marker updates
What's NOT done (yet):
❌ Real passenger count from actual boarding/alighting
❌ Live data from physical buses
❌ Predictive occupancy (AI-based forecasting)
Just Day 4: Occupancy Transparency + Global Visibility.
Why this matters:
🚌 Commuters: Know if you'll get a seat before you walk to the stop
💻 Developers: We're testing real-time data sync + map clustering at scale
🏢 Operators: Capacity visibility = better route planning + resource allocation
🔐 Privacy-first: Aggregated data only, no individual tracking (by design)
→ Follow Bubblebitx Labs for raw build logs.
#BuildInPublic #MobilityTech #WebDev #UXDesign #India
The network for creativity
Join 1.25M professional creatives like you
Connect with clients, get discovered, and run your business 100% commission-free
Creatives on Contra have earned over $150M and we are just getting started
Related posts
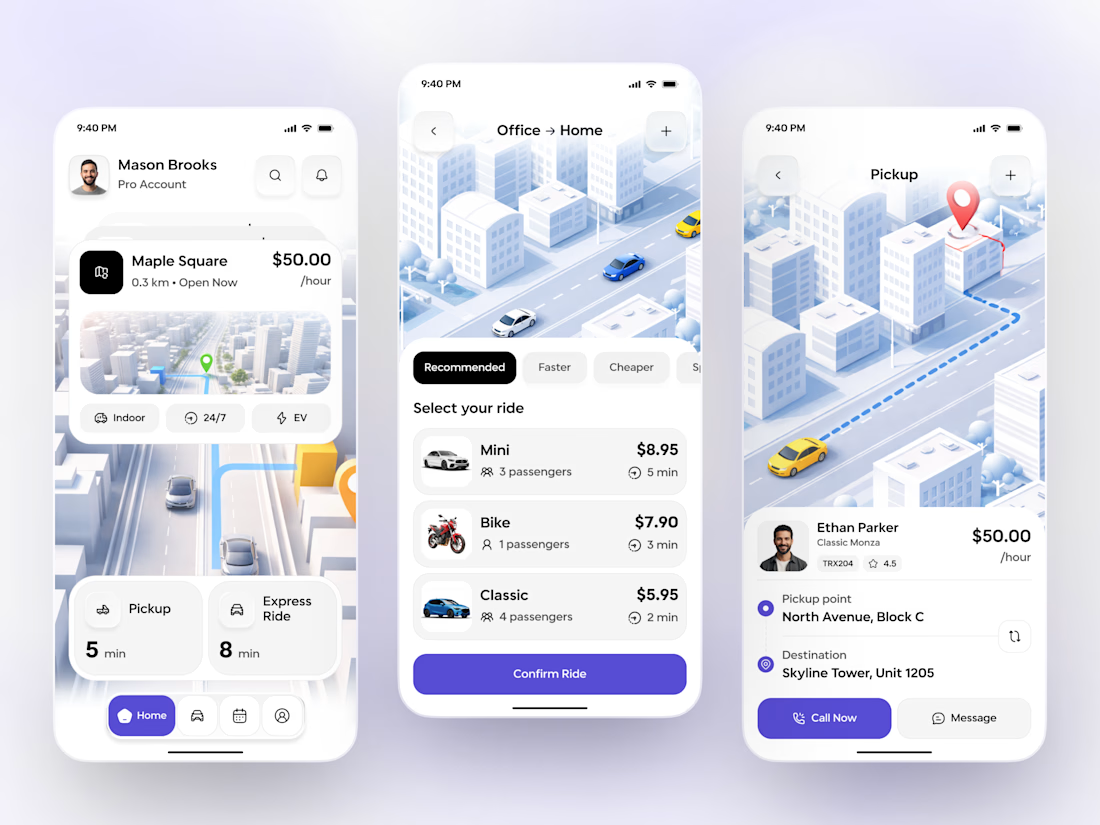
Ride Booking App UI/UX – Clean Mobility Experience
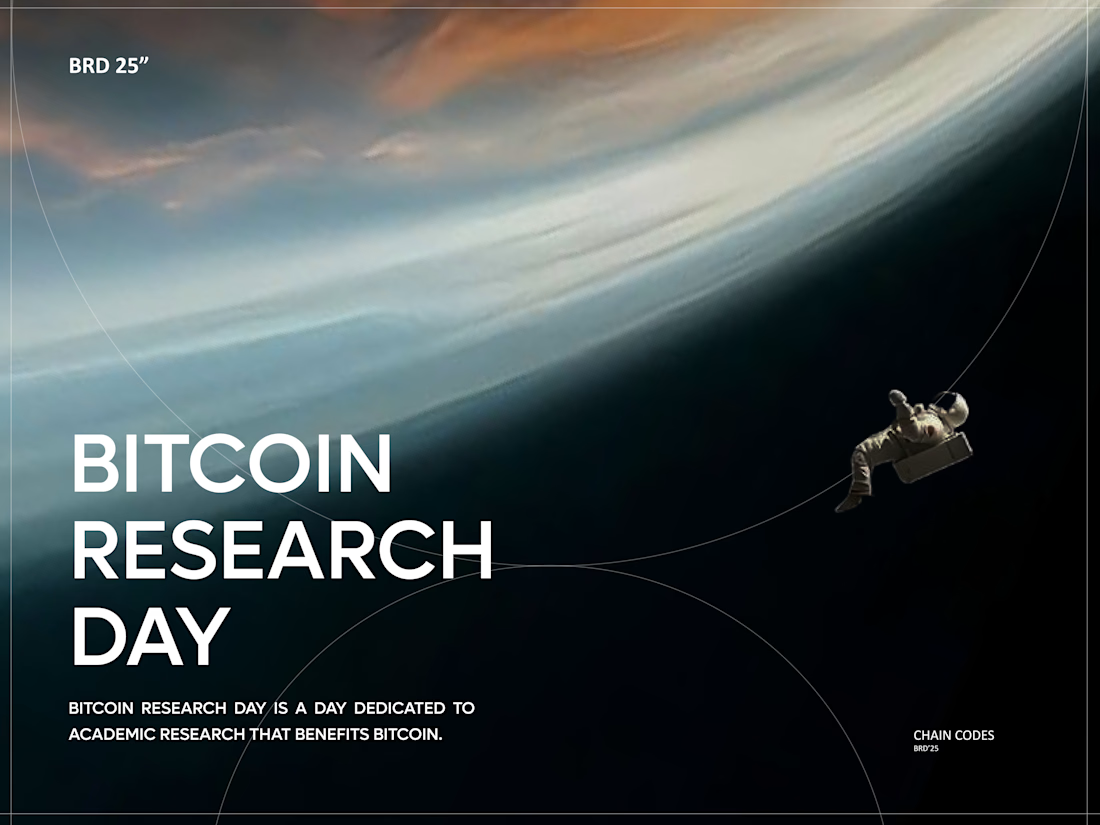
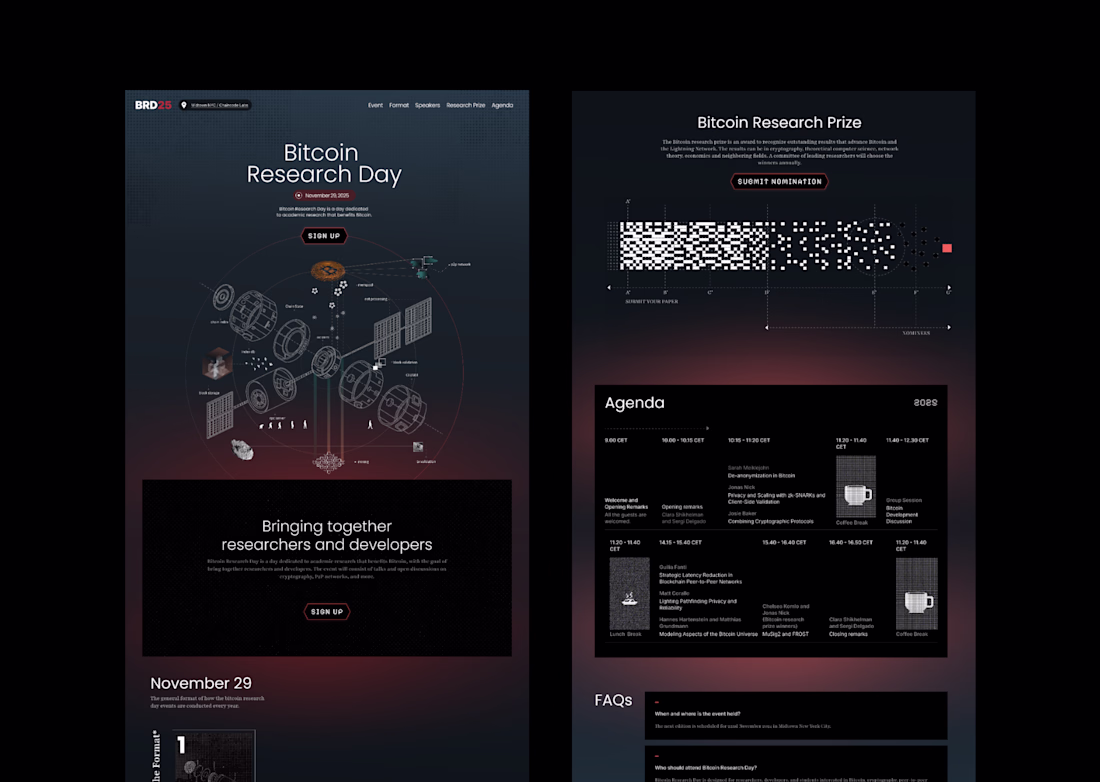
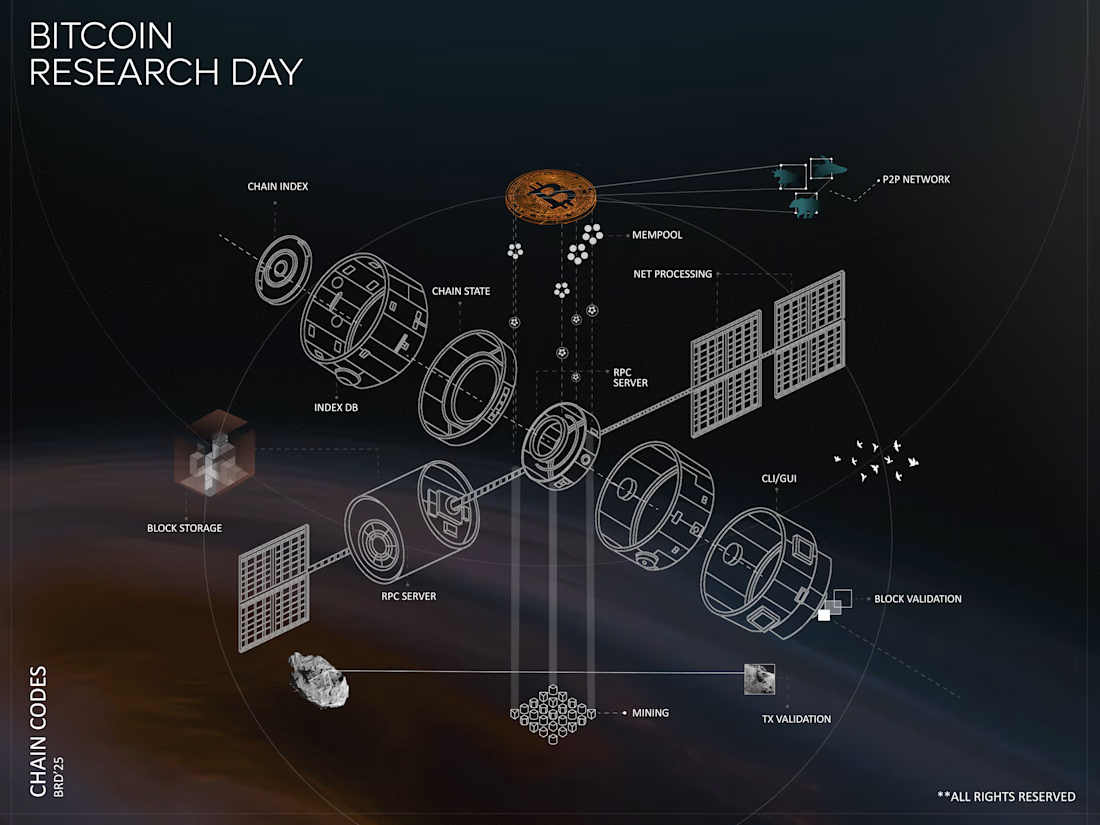
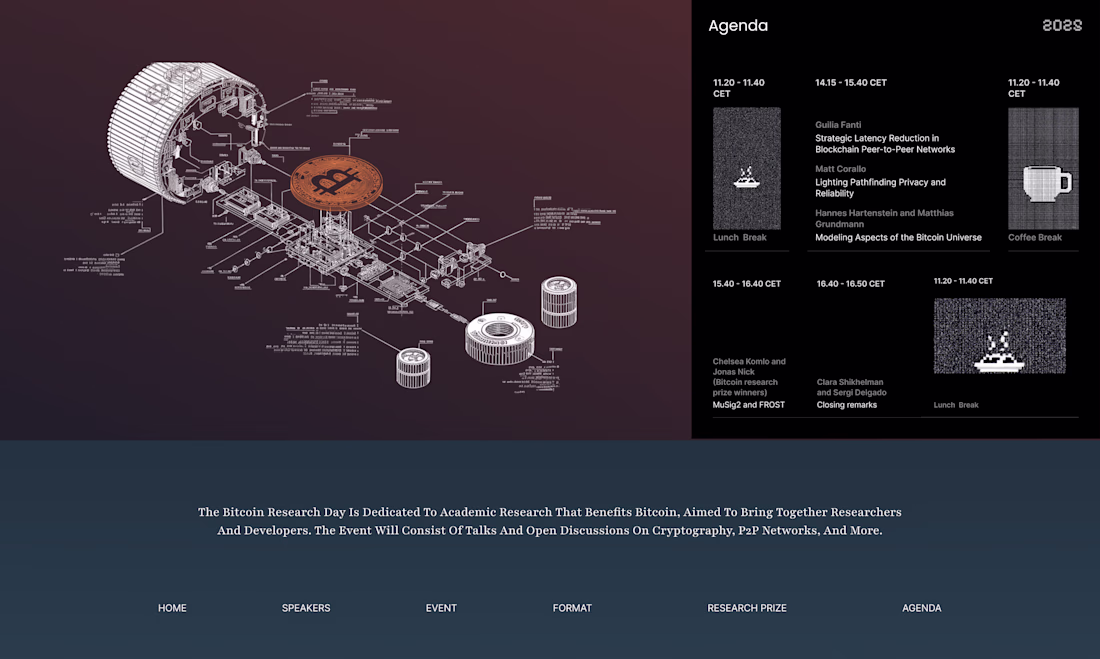
Redesigning the Hub for Bitcoin Innovation 💎
I recently wrapped up the redesign for Bitcoin Research Day. When you’re dealing with world-class researchers from MIT and Princeton, the design needs to be as precise as the code.
The Focus: * Refined UI/UX for the BRD'25 Agenda.
A credible, high-end visual language for @ChaincodeLabs.
Frictionless registration and prize submission flows.
Complex products don't have to feel complicated.
Live Site: https://brd.chaincode.com/
Live Events Mobile App Discovery, Booking & Split Bill Flow
This is the discovery and booking flow for a live events mobile app built around one feature that separates it from every other event app out there.
The split bill.
Not a separate screen. Not an afterthought. Built directly into the booking flow so anyone in the group can pay their share instantly no awkward follow-ups, no separate payment apps, no "I'll send you later" moments.
The UI was structured entirely in Figma from component architecture to the full prototype while Jitter handled the micro-interactions and transitions that make the flow feel connected rather than just functional.
The rest of the flow matches that same clarity. Location-aware event discovery. Popular and ongoing event sections. A detail screen with host contact, ticket tier selection, and total amount visible before the final tap.
Every screen answers the next question before the user asks it. Every transition earns its place.
That's what makes a booking flow feel finished not just designed.
See the full case study 👉 https://www.behance.net/gallery/247306827/Instant-Event-APP-UI-UX-Mobile-App-Orbix-Studio
Trending
Runway
AI video generation is exploding. What are you dreaming up in Runway?
Contra University
Learn from expert creatives how to earn more using next-gen AI tools.
creativeaiflow
Creative AI workflows are evolving. What tools do you use, and what are their strengths and weaknesses?
portfolioreview
The best portfolios tell a story, not just show a grid. Share yours for feedback.
freelancerlife
Freelancer life is wins, pivots, and everything in between. What’s yours right now?