The network for creativity
Join 1.25M professional creatives like you
Connect with clients, get discovered, and run your business 100% commission-free
Creatives on Contra have earned over $150M and we are just getting started
Back to feedPost

Your spreadsheet has 10,000 rows.
You know the answer is in there somewhere.
You just can't see it.
That's not a data problem. That's a visibility problem.
I take messy CSVs, databases, and API exports — clean
them up, find the patterns, and turn them into dashboards
you can actually use.
Not pretty charts for the sake of pretty charts.
Insights that answer the question you actually have.
Built a live price comparison dashboard scraping 1,000+
products across Lazada and Zalora Malaysia. Discount
patterns, price gaps, brand distribution — all visible
in one place.
If you're sitting on data and not sure what it's
telling you, that's exactly the problem I solve.
Drop me a message.
The network for creativity
Join 1.25M professional creatives like you
Connect with clients, get discovered, and run your business 100% commission-free
Creatives on Contra have earned over $150M and we are just getting started

Challenges
View all


Related posts


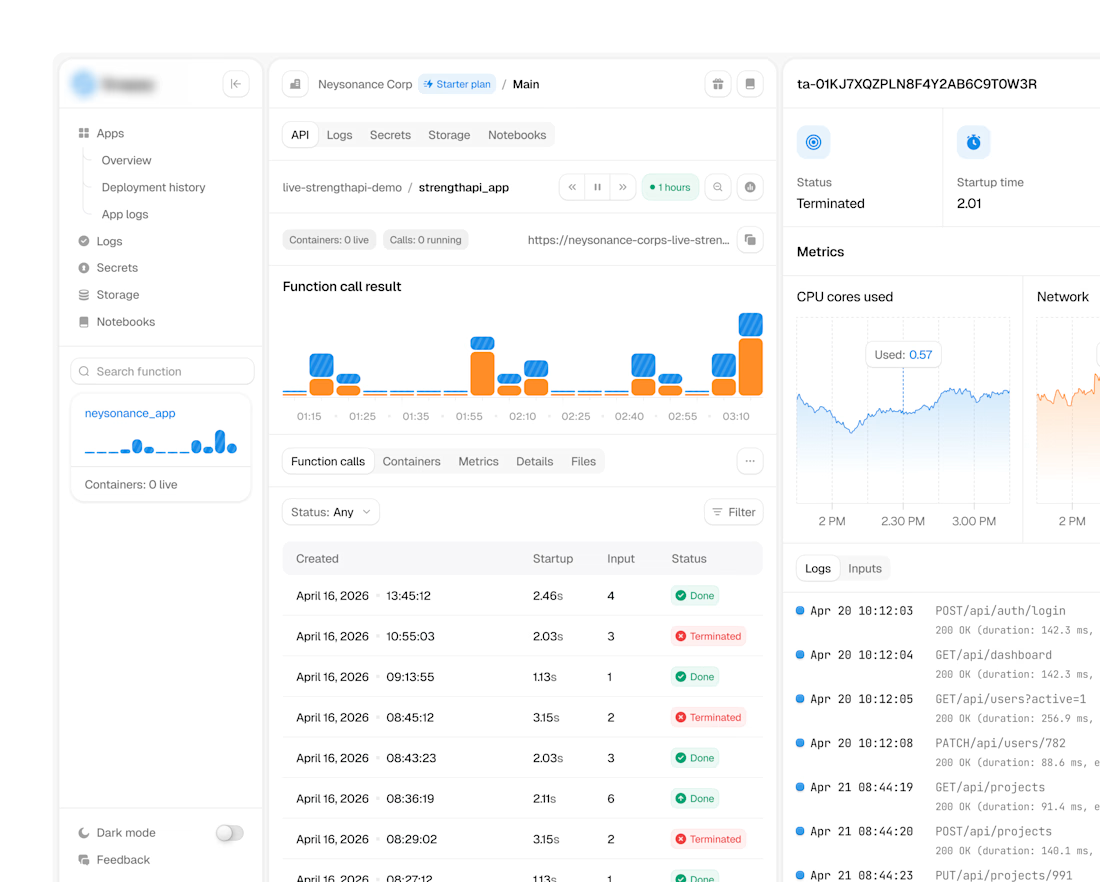
ultra-complex analytics dashboard

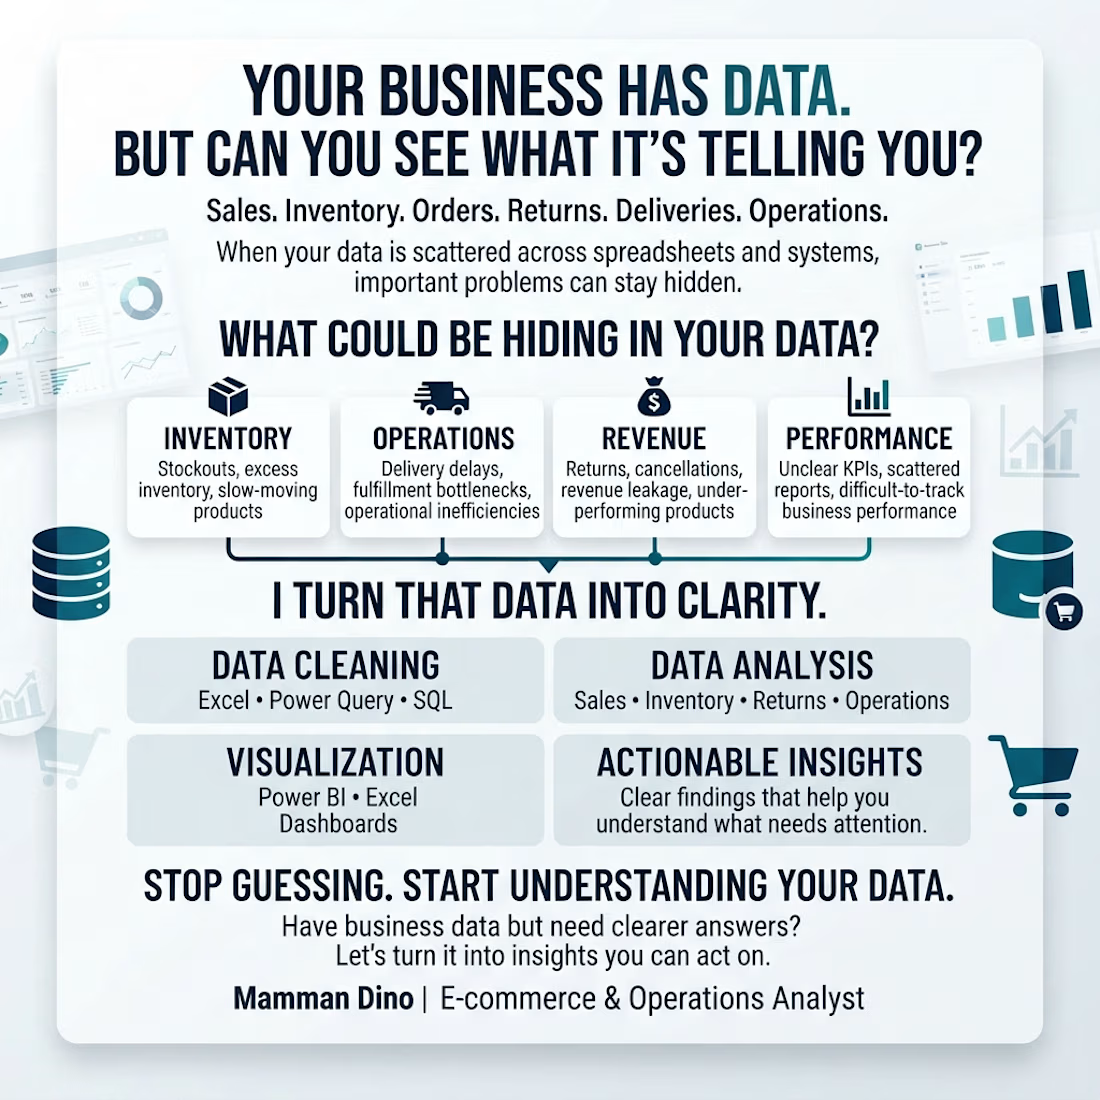
Your business is generating data every day.
But can you quickly answer:
📦 Which products are at risk of stockouts?
🚚 Where are delivery and fulfillment problems happening?
💰 Which products or processes are affecting revenue?
📊 Which numbers actually need your attention?
That’s where I come in.
I help e-commerce and operations businesses clean, analyze, and visualize their data using Excel, Power Query, SQL, and Power BI.
The goal isn't just another dashboard.
It’s clearer answers, better visibility, and insights you can act on.
If your business has data but you're struggling to turn it into decisions, let's talk.
#Ecommerce #Operations #DataAnalytics #PowerBI #SQL #Excel #BusinessIntelligence


The overall feel of the site is really amazing 🙌