The network for creativity
Join 1.25M professional creatives like you
Connect with clients, get discovered, and run your business 100% commission-free
Creatives on Contra have earned over $150M and we are just getting started
Back to feedPost

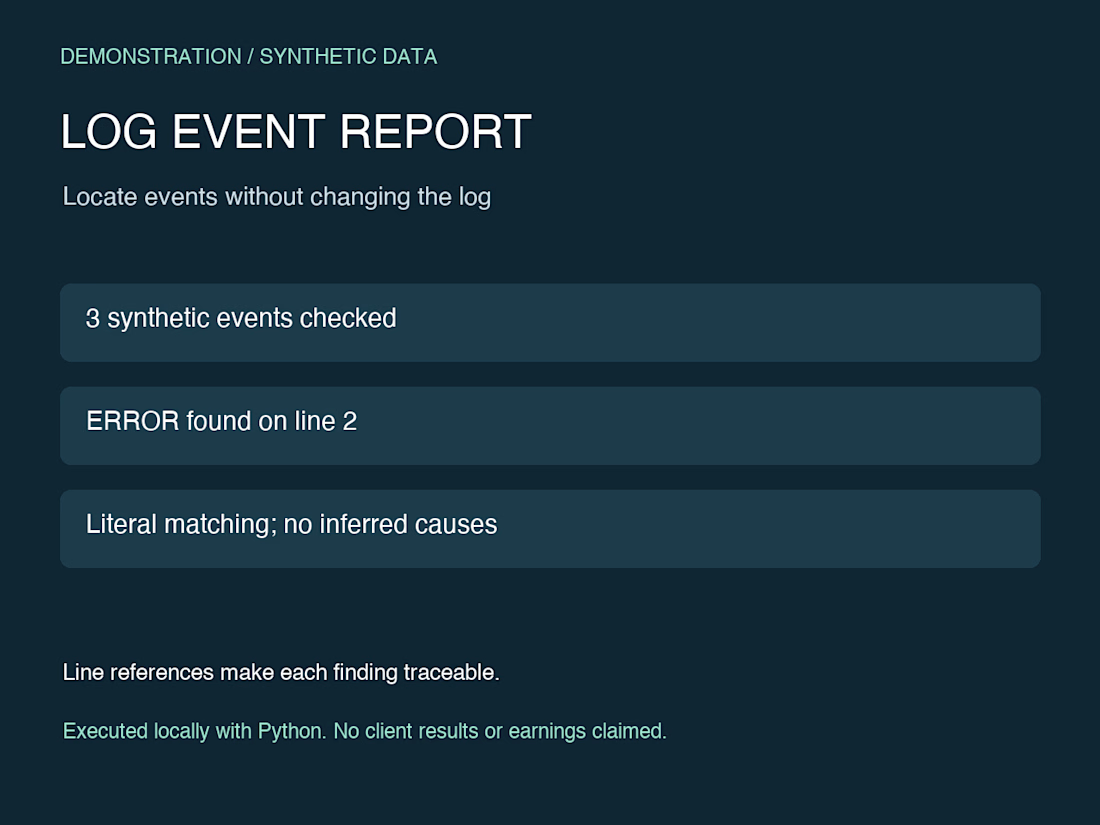
Log event report — synthetic portfolio demonstration. A three-event log was checked for the literal text ERROR. The report identifies line 2 without inventing a root cause or altering the log. Line references make each finding traceable. Executed locally with Python. AI-assisted preparation; no client project or earnings claimed.

The network for creativity
Join 1.25M professional creatives like you
Connect with clients, get discovered, and run your business 100% commission-free
Creatives on Contra have earned over $150M and we are just getting started




Related posts

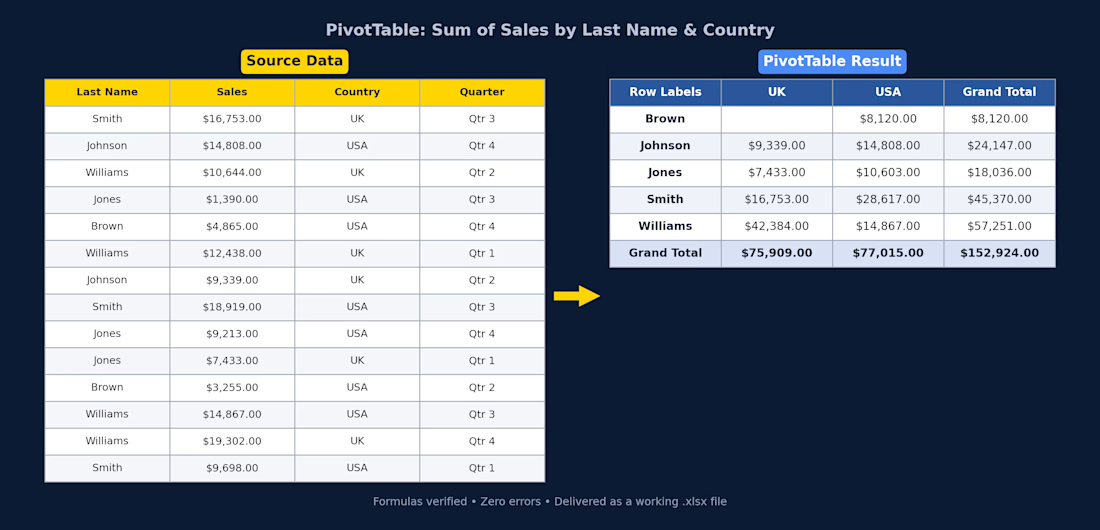
Excel PivotTable — Sales Summary
Client had raw sales data (14 rows across UK/USA, split by quarter) and needed it turned into something actually usable. I cleaned it up and built a PivotTable that breaks total sales down by rep and country, with grand totals for both.
What I did:
Structured the raw data into a proper table (consistent headers, currency formatting)
Built a PivotTable summarizing Sum of Sales by Last Name and Country
Used SUMIFS so the totals update automatically if the source data changes — nothing hardcoded
Checked every formula for errors before delivery
Delivered as a working .xlsx file, ready to plug into a bigger report or dashboard.
If you've got messy sales/ops data sitting in a spreadsheet and need it turned into something you can actually read at a glance, this is exactly the kind of thing I can help with.


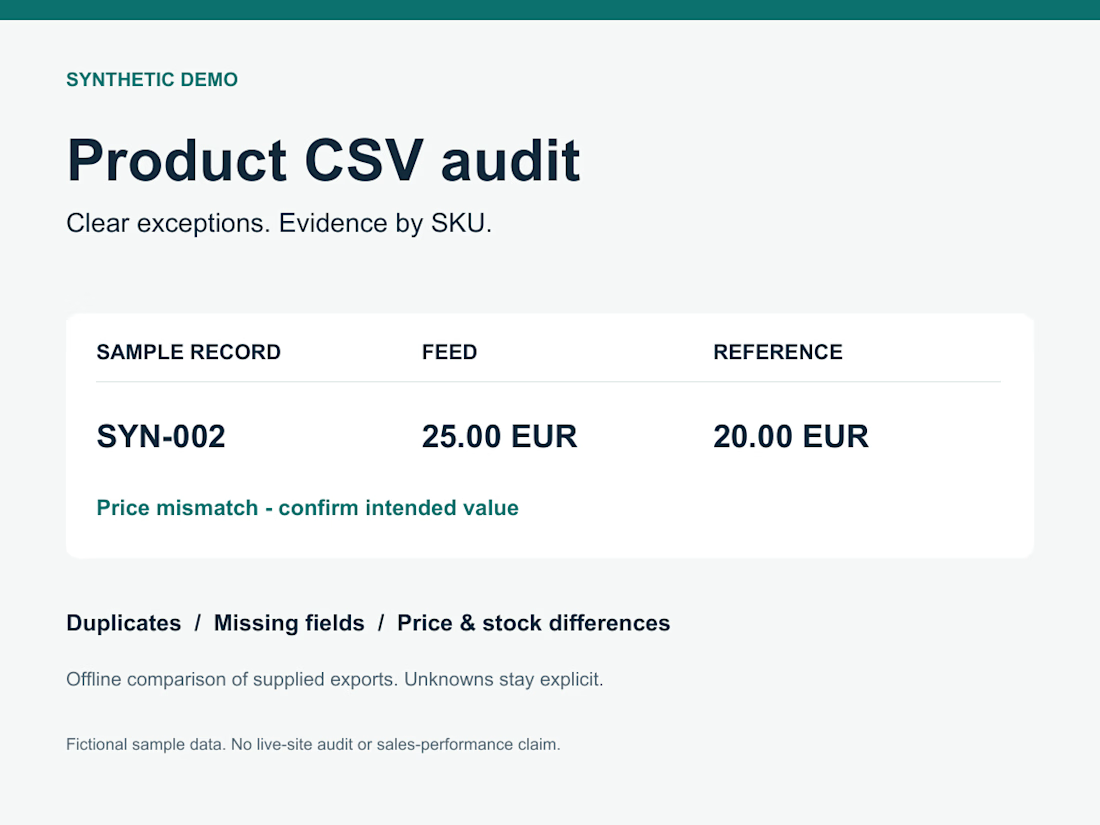
A product-feed audit demo built to catch catalog errors before an import. The Python checker compares two CSV exports and reports duplicate IDs, price differences, stock mismatches and cases that need manual review.
This sample uses synthetic data: 12 feed records, 9 reference records, 9 error findings and 7 unresolved findings. The checks have 13 passing tests. It is a demonstration of the workflow, not a client result or a live-store audit.

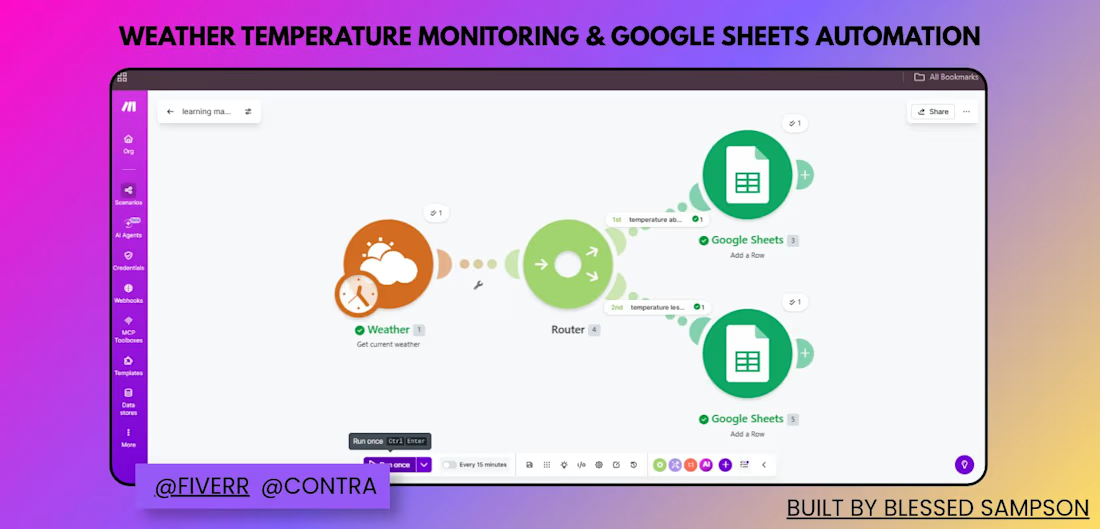
Built an automated weather monitoring system that logs conditions to Google Sheets based on temperature thresholds.
Instead of manually checking weather data and logging it, I built a Make.com scenario that:
Pulls current weather data on a schedule (Weather module)
Routes the data based on temperature conditions
Logs the results into different Google Sheets tabs/rows depending on which condition is met
Result: Weather data is now tracked automatically and organized by condition — no manual checking or data entry required, and the log stays consistently up to date.