The network for creativity
Join 1.25M professional creatives like you
Connect with clients, get discovered, and run your business 100% commission-free
Creatives on Contra have earned over $150M and we are just getting started
Back to feedPost


The network for creativity
Join 1.25M professional creatives like you
Connect with clients, get discovered, and run your business 100% commission-free
Creatives on Contra have earned over $150M and we are just getting started


Related posts


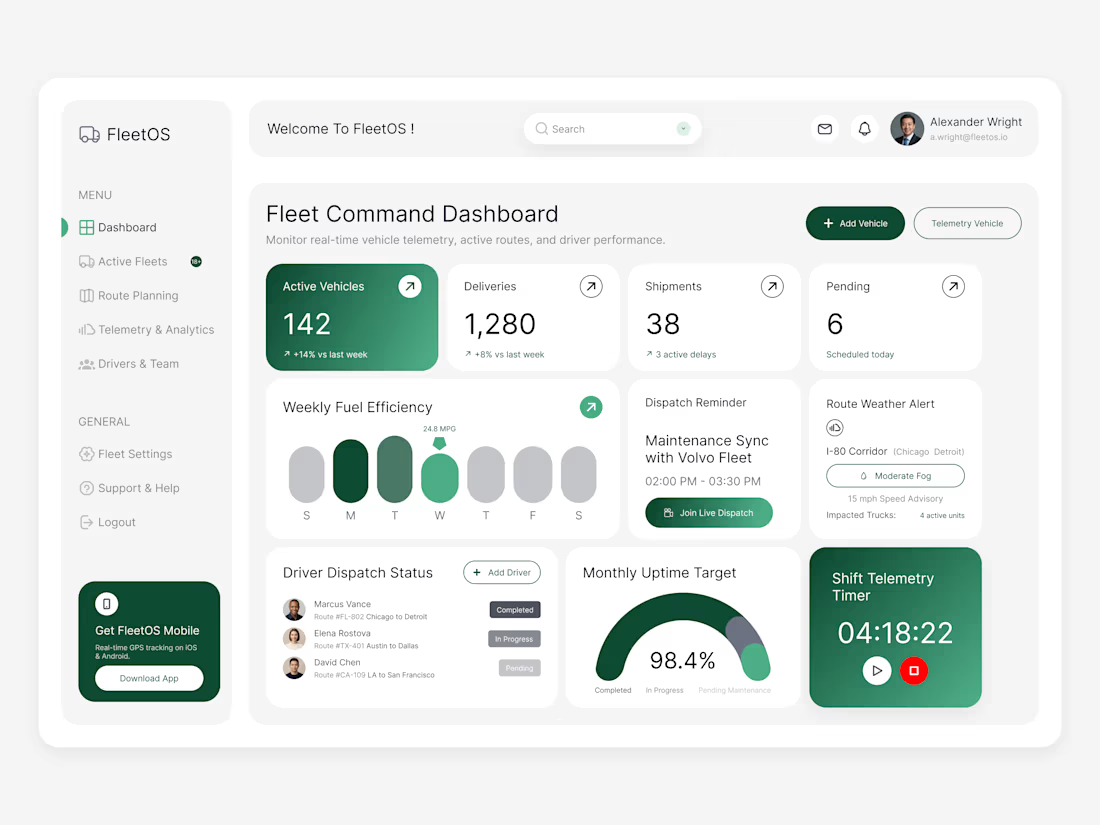

Clean dashboard!

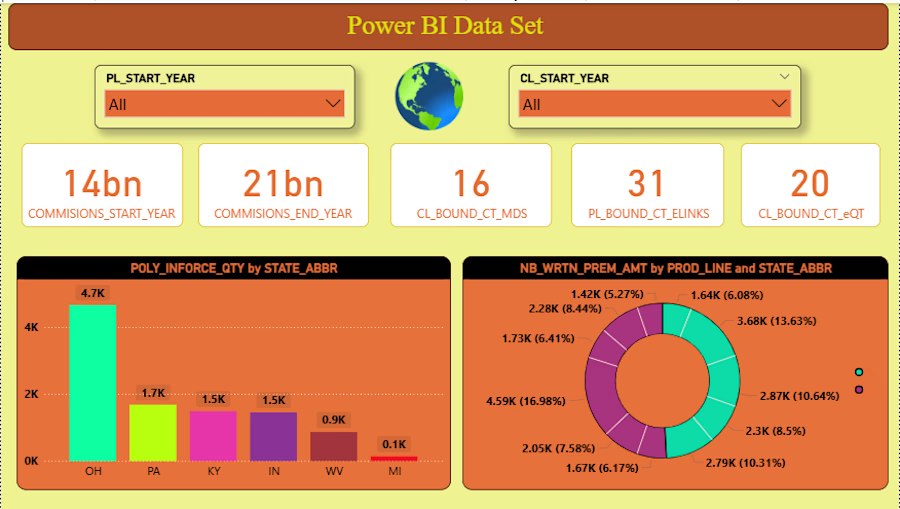
Power BI Project Description🩻
Sales Performance Dashboard | Power BI🙌
Developed an interactive Power BI dashboard to analyze sales performance, customer behavior, and business KPIs. The solution transforms raw data into actionable insights through dynamic visualizations and automated reporting.
Key Features:
Interactive KPI cards for Revenue, Inforce Policy Orders, and Growth
Sales analysis by State, Product Category, and Policy Segment
Dynamic slicers and drill-through functionality
Year-over-Year (YoY) performance tracking
Profitability and trend analysis using DAX measures
Data modeling with relationships and star schema design
Automated data refresh and optimized report performance
Tools & Technologies:
Power BI Desktop
Power Query
DAX
SQL / Excel Data Sources
Data Modeling & Visualization
Skills Tags🔥
Power BI • DAX • Power Query • Data Visualization • Business Intelligence • Dashboard Design • SQL • Data Analytics


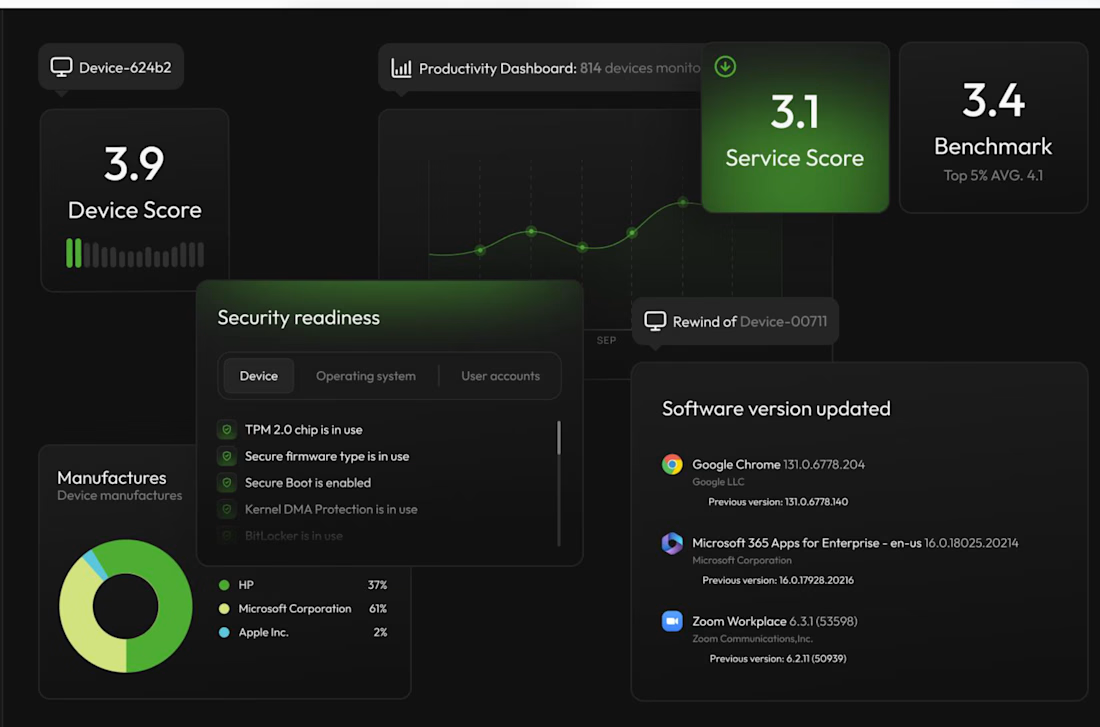
Device Health Monitoring Dashboard
Device monitoring
Analytics and reporting
Status tracking
Error monitoring


Nice dashboard work!