The network for creativity
Join 1.25M professional creatives like you
Connect with clients, get discovered, and run your business 100% commission-free
Creatives on Contra have earned over $150M and we are just getting started
Back to feedPost

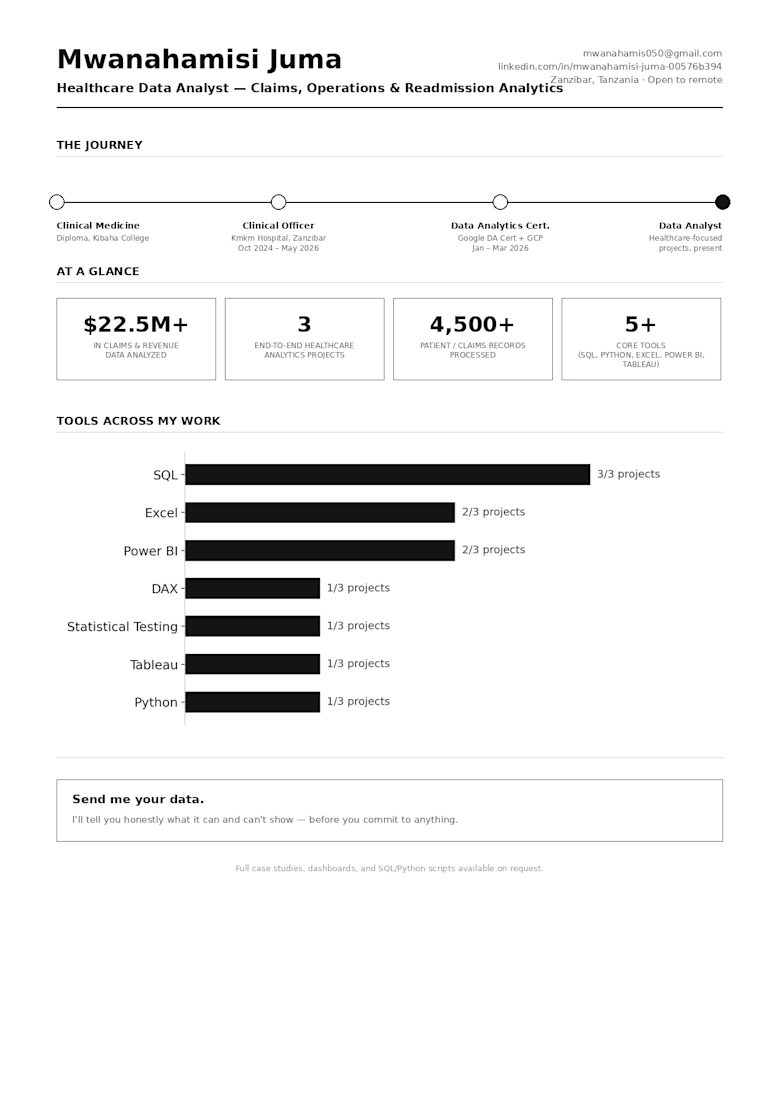
Two years ago I was working as a Clinical Officer, not a data analyst. I saw hospital numbers every day — appointments, billing, readmissions — but I didn't have the tools to actually dig into them.
Now I do. And here's what I've learned: a lot of hospitals and insurers are sitting on numbers that could save them real money, if someone actually analyzed them properly.
Here's a sample of what turned up across three recent projects:
📊 Hospital operations — I analyzed appointment and billing data and found that 51.5% of appointments ended in a no-show or cancellation, and 33% of payments failed outright. Chemotherapy and MRI turned out to be the top revenue-generating services — which changes where you'd prioritize fixing the leaks.
📊 Patient readmissions — I found that a single prior readmission more than doubled a patient's risk, from 27.79% to 69.50%. Patients with four or more comorbidities crossed 75%. Numbers like that can actually change how discharge planning gets done.
📊 Insurance claims — I analyzed 4,500 claims worth $22.5M and found something unexpected: patient age, income, and gender weren't significantly associated with claim cost. Pediatrics was the real cost driver at $4.9M — the specialty mattered, not the demographics.
I do this work with SQL, Python, Excel, Power BI, and Tableau — but the tools alone aren't the point. My clinical background is what helps me understand what's actually happening behind each number, not just what's sitting in a spreadsheet column.
If you've got operations, claims, or readmission data you haven't fully dug into — send me a sample. I'll tell you honestly what it can (and can't) show before you commit to anything.
The network for creativity
Join 1.25M professional creatives like you
Connect with clients, get discovered, and run your business 100% commission-free
Creatives on Contra have earned over $150M and we are just getting started





Related posts


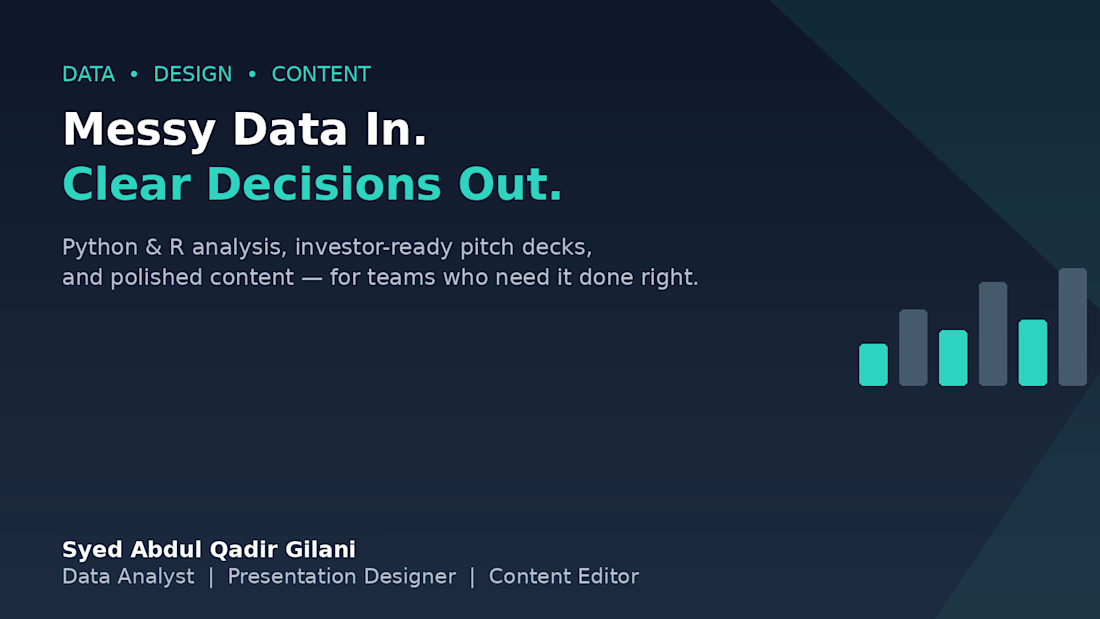
Messy Data In. Clearer Decisions Out. 📊
Over the past year, I've noticed most businesses don't struggle because they lack data — they struggle because that data never turns into a decision.
That's the gap I work in:
→ Cleaning and analyze data with Python & R
→ Turning findings into investor-ready pitch decks
→ Polishing the final write-up so nothing gets lost in translation
If your team has data sitting in spreadsheets with no story attached, or a pitch deck that needs to actually land — that's exactly where I can help.
Open to projects. Let's talk 👇


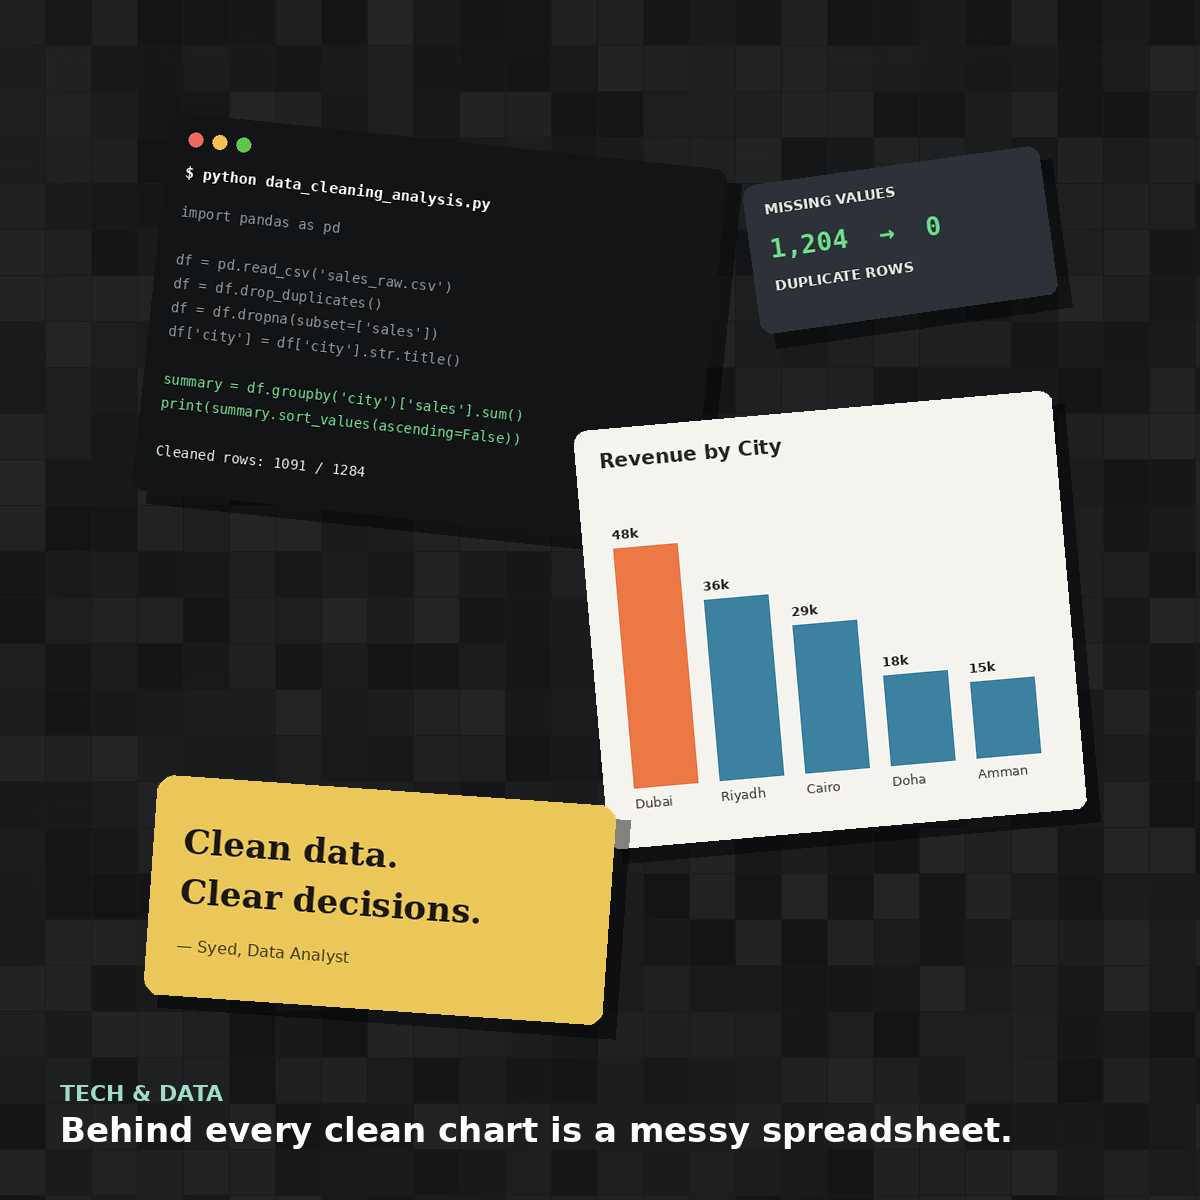
Behind every clean chart is a messy spreadsheet 🧹
This is what a real data cleaning job looks like before it becomes an elegant bar chart — duplicate rows, missing values, inconsistent formatting, all sorted out with Python and Pandas.
#collage attempt: a look inside the data analyst's actual desk, not just the pretty output.

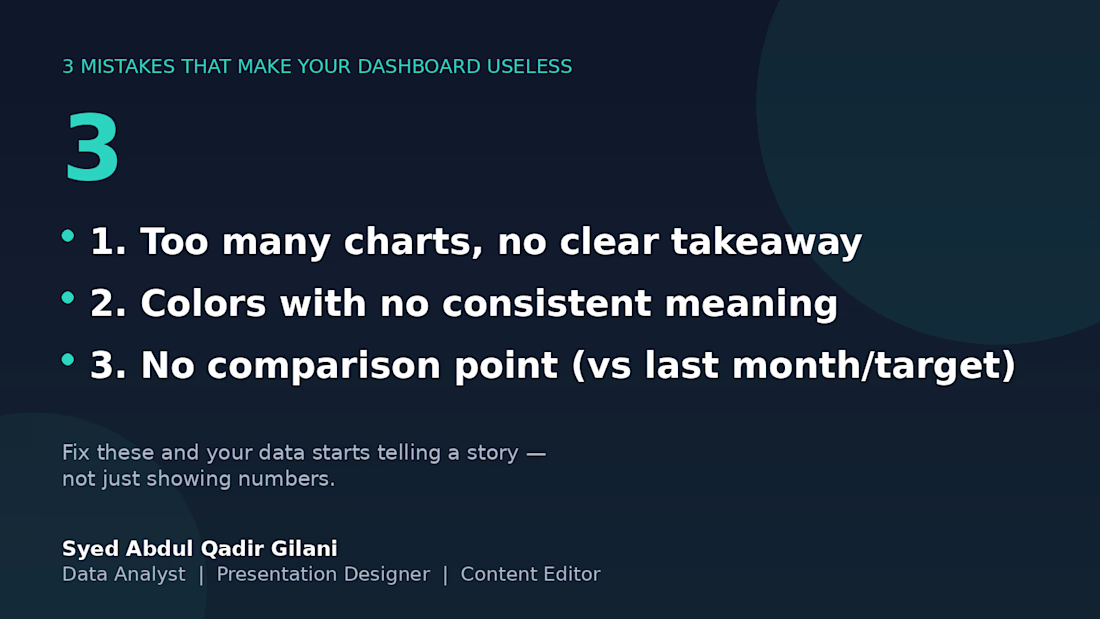
3 mistakes that will eventually make this board useless. 📉
I've reviewed several client dashboards over the years, and the same 3 problems show up over and over:
1️⃣ Too many charts, no clear takeaway — if I can't tell what to do after looking at it, it's decoration, not a dashboard.
2️⃣ Colors with no consistent meaning — red means "unacceptable" on one chart and "category 3" on the next. Pick a system and stick with it.
3️⃣ No comparison point — a number alone means nothing. "Revenue: $12,480" tells you nothing. "Revenue: $12,480 (+18% vs last month)" tells you everything.
Fix these three, and your data stops being numbers on a page — it starts being something people actually use to decide.
What's the most common dashboard mistake you've seen? 👇