The network for creativity
Join 1.25M professional creatives like you
Connect with clients, get discovered, and run your business 100% commission-free
Creatives on Contra have earned over $150M and we are just getting started
Back to feedPost

Created a streamlined operations tracker to manage scheduling, care details, and daily workflow in one place.
This system helps reduce missed information, improve organization, and keep everything running efficiently without relying on scattered notes or back-and-forth communication.
I specialize in building simple, effective systems like this for small businesses that need structure without complexity.
If your backend feels disorganized, I can help you fix that.


The network for creativity
Join 1.25M professional creatives like you
Connect with clients, get discovered, and run your business 100% commission-free
Creatives on Contra have earned over $150M and we are just getting started



Related posts

🚀 Turning Manual E-commerce Order Processing into an Automated Workflow with n8n
Manual order management may seem simple, but copying customer details, checking information, preventing duplicate orders, and sending confirmation emails can quickly become repetitive and error-prone.
I recently built an end-to-end order processing automation using n8n to solve these challenges for a handmade products store.
Here's what I implemented:
🔹 Automated Order Capture: Receive new orders through a webhook.
🔹 Data Validation & Cleaning: Validate required fields, email formats, quantities, and prices before processing.
🔹 Duplicate Prevention: Detect existing Order IDs to prevent duplicate records.
🔹 Google Sheets Integration: Automatically store valid orders and calculate order totals.
🔹 Email Notifications: Send order updates to the store owner and confirmation emails to customers.
🔹 Error Monitoring: Capture failed executions, log error details in a dedicated Google Sheets tab, and send email alerts.
The goal was simple: reduce repetitive administrative work, improve data accuracy, and make order operations more reliable.
This is what I enjoy about building with n8n — turning complex, repetitive business processes into practical automation systems.
Have a repetitive workflow in your business that could be automated? Let's connect!
#n8n #WorkflowAutomation #EcommerceAutomation #BusinessAutomation #NoCode #Automation


Using AI Automation workflow in business , not only save the time ,also increase work Efficiency

This video demonstrates an interactive inventory analytics application designed to help operations teams monitor stock availability, identify supply shortages, and make informed replenishment decisions.
Using 16 populated synthetic inventory records, the walkthrough demonstrates how changes in stock quantities and supplier lead times automatically update inventory risk calculations.
What the Video Demonstrates
Inventory Dashboard: Displays stock availability, six stockout-risk items, and seven replenishment candidates.
Stockout Risk Detection: Identifies products that may run out before replacement inventory arrives.
Supplier Delay Simulation: Demonstrates how changing lead times affects replenishment calculations and risk exposure.
Interactive Inventory Management: Shows how stock adjustments immediately update dashboard metrics.
Replenishment Analytics: Calculates reorder points using demand, lead time, and safety stock.
Reporting: Provides calculated inventory results and export capabilities.
Technical Implementation
Developed the interactive dashboard, inventory calculation logic, scenario controls, risk filtering, and data import/export functionality using JavaScript, HTML5, and CSS3.
The demonstration showcases a functional inventory management analytics application with reproducible calculations and clearly identified synthetic data.


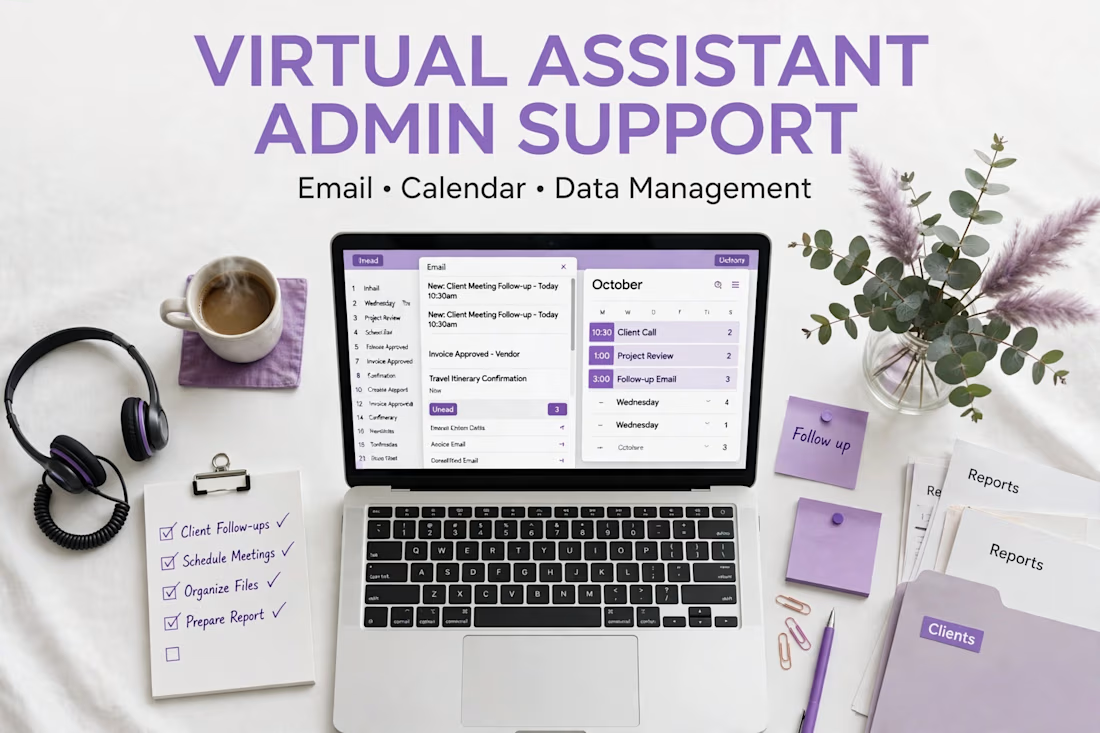
Virtual Assistant Admin Support - I help busy business owners with daily admin work. I manage emails, schedule meetings, and organize files.