The network for creativity
Join 1.25M professional creatives like you
Connect with clients, get discovered, and run your business 100% commission-free
Creatives on Contra have earned over $150M and we are just getting started
Back to feedPost
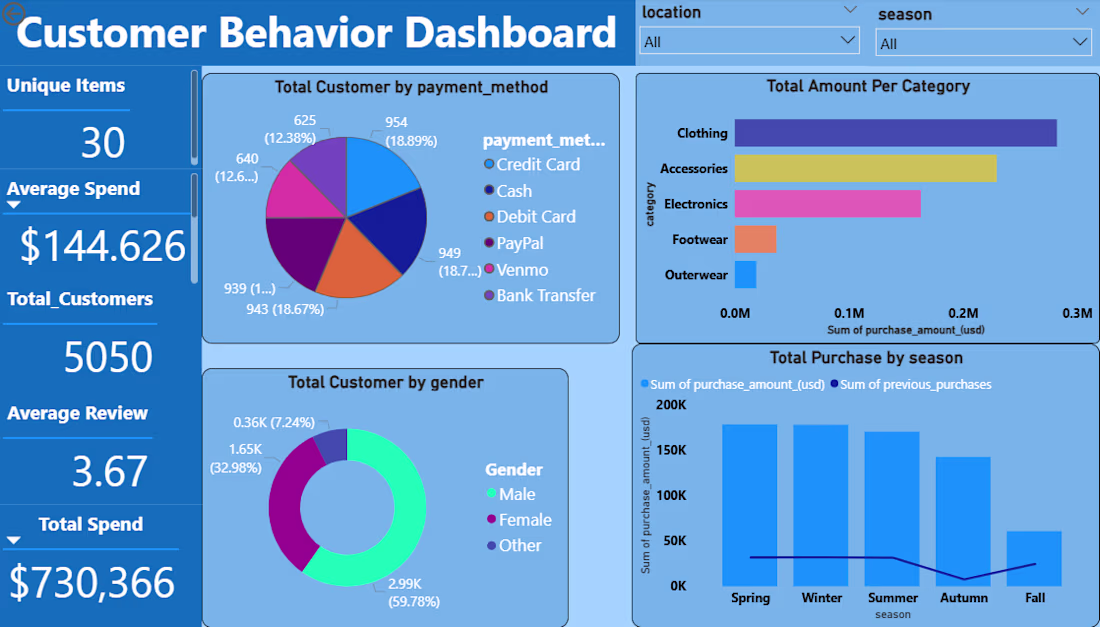
📊 Customer Behavior Dashboard Project
Excited to share my latest Power BI dashboard focused on Customer Behavior Analysis!
Using SQL, PostgreSQL, Python (Pandas), and Power BI, I analyzed customer purchasing patterns, spending habits, payment preferences, and seasonal sales trends.
🔹 Total Customers: 5,050
🔹 Total Revenue: $730K+
🔹 Average Spend: $144.63
🔹 Category Performance Analysis
🔹 Customer Demographics Insights
🔹 Seasonal Purchase Trends
🔹 Interactive Filters for Dynamic Exploration
This project helped me strengthen my skills in data cleaning, SQL analysis, ETL processes, and dashboard design while transforming raw data into actionable business insights.
The network for creativity
Join 1.25M professional creatives like you
Connect with clients, get discovered, and run your business 100% commission-free
Creatives on Contra have earned over $150M and we are just getting started
Related posts
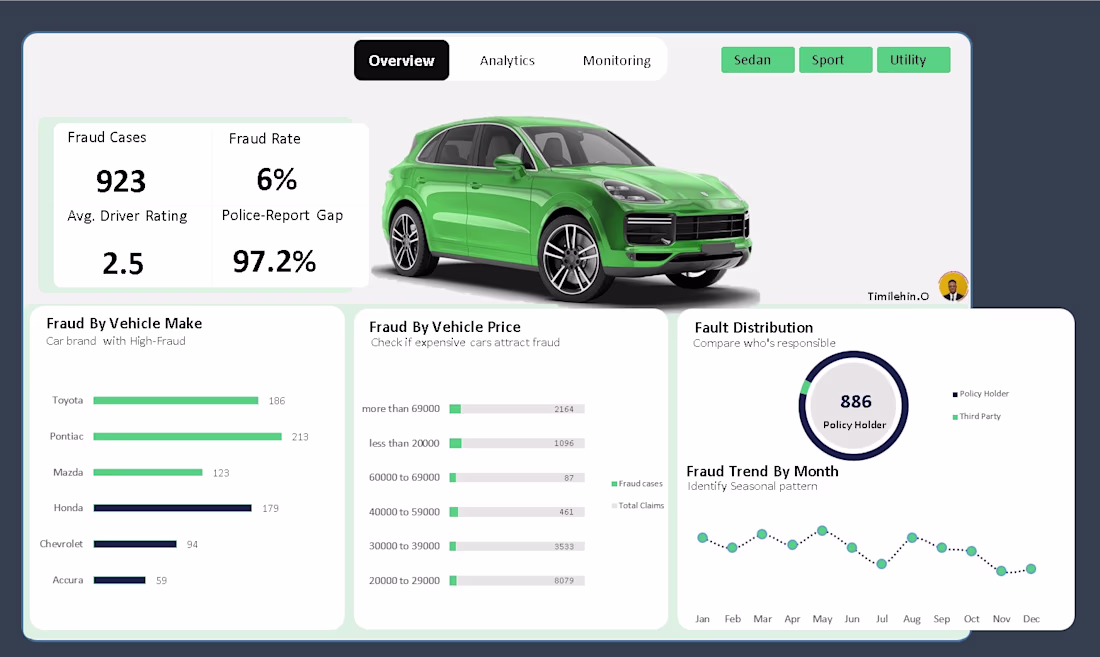
Fraud doesn’t always look suspicious, until you analyse the patterns.
I recently worked on a Vehicle Insurance Claim Fraud Analysis case study where the goal was simple:
👉 identify hidden risk signals and process gaps that allow fraudulent claims to slip through.
🔍 The problem
Insurance teams deal with thousands of claims, but:
• Fraud is often buried inside normal-looking transactions
• Manual checks miss systemic weaknesses, not just bad actors
• High-risk signals are rarely quantified clearly
So I approached this as a real-world fraud analyst, not just a dashboard exercise.
🛠️ What I did (end-to-end)
Using Excel analysis, I:
• Cleaned and structured claim-level data
• Defined fraud-focused KPIs, not vanity metrics
• Built an interactive dashboard with slicers to simulate decision-making
📊 Core KPIs tracked
• Fraud Rate (%)
• Total Fraud Cases
• Average Driver Risk Rating (Fraud)
• Police Report Gap (%) - fraud claims filed without police reports
🚨 Key insights discovered
• Fraud concentration varied strongly by vehicle price band, not just volume
• Certain vehicle categories consistently showed higher fraud exposure
• An alarming 97%+ of fraudulent claims lacked police reports, highlighting a major verification gap
• Driver risk ratings provided early signals that could support preventive controls
These insights aren’t theoretical, they point directly to where insurers are leaking money.
💡 Business impact (how this helps)
This type of analysis helps organisations:
• Flag high-risk claims earlier
• Strengthen fraud prevention rules
• Improve compliance and documentation checks
• Reduce payout losses without increasing manual workload
🧠 Tools & skills applied
Excel (Advanced Pivot Analysis)
Fraud & Risk Analytics
Dashboard Storytelling
Business Intelligence Thinking
I’m building and sharing real fraud analytics case studies as I continue to grow in this space, focusing on credit card, insurance, and transaction fraud.
If you’re a:
• Fraud / Risk Manager
• Insurance or FinTech team
• Founder needing data-driven fraud insights
I’m open to conversations and collaboration.
#FraudAnalytics #FraudDetection #RiskAnalytics #BusinessIntelligence #ExcelDashboard #DataAnalytics #BuildInPublic
wow this is very insightful
I want to create this really cool local dashboard that would have true meaning and purpose for residents of Pompano Beach.
I recorded a Tella to explain with examples, which I sent to a few people, but I'm waiting to hear back.
If there are any devs, vibe coders or techies or just someone not a writer like me, lol, could tell me who I need (skillset wise) and if they have any recommendations -- affordable and efficient -- this is an MVP. :))) And this is not something I'll profit off of btw. :)
Please message me if you don't mind watching my video and guiding me in the right direction. I'm pretty psyched about it. :D
Link to Video >
tella.tv
Project Request: Build me an election dashboard for upcoming local commission election. — Tella
I’m looking for help in developing a strategic plan (execution mainly) for an upcoming local commissioner election in Pompano Beach, Florida.
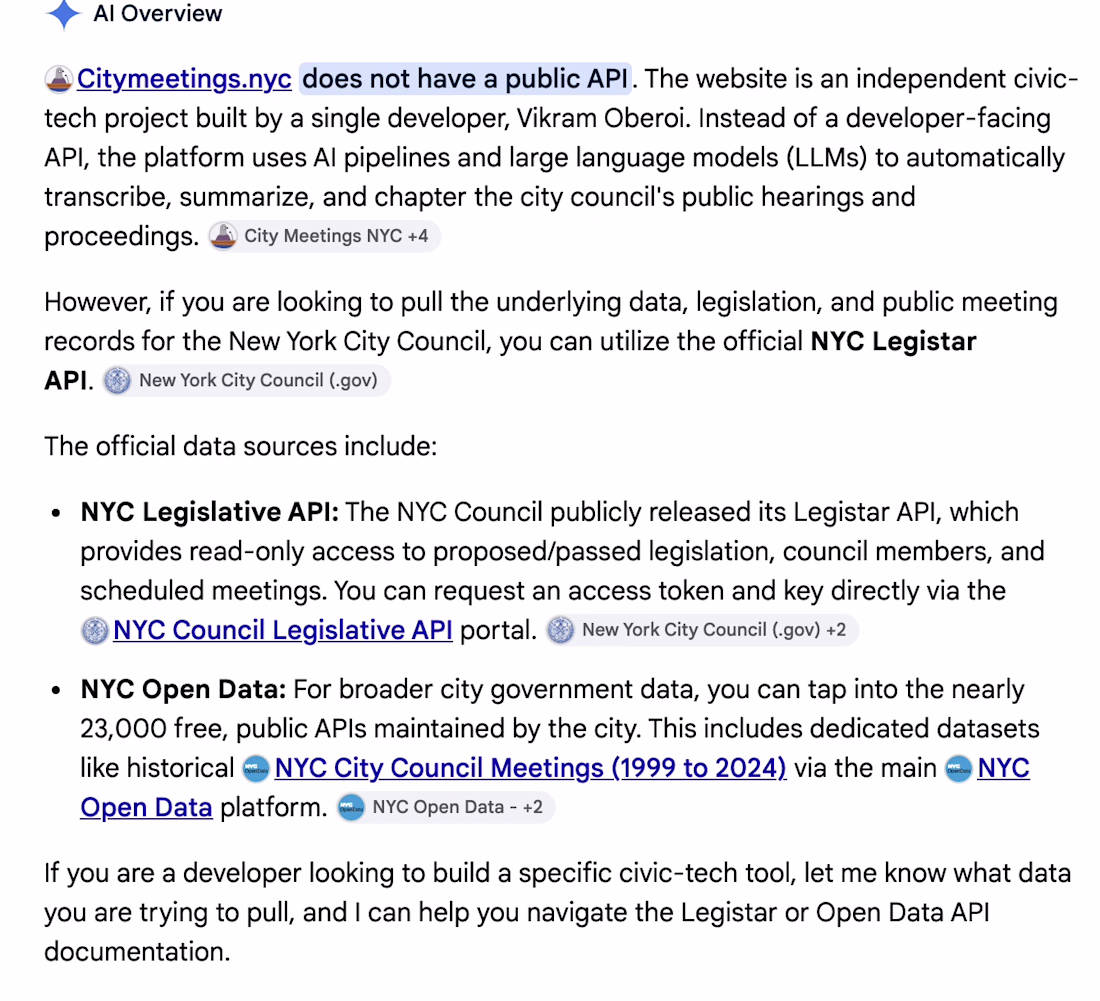
citymeetings.nyc is similar, and this is how they did it.
Coinix — Crypto Dashboard
Most crypto dashboards overwhelm you.
This one commands you. 🪙
Dark, fast, and brutally clean built for traders who think in seconds.
→ Live asset tracking
→ One-screen portfolio clarity
→ Motion design that makes data breathe
Data should feel in control, not chaotic.
Drop your feedback below 👇
WOw Amazing Work Brother
Challenges
View allTrending
Claude
Claude has entered the design space. How are you using Claude Design?
Contra University
Learn from expert creatives how to earn more using next-gen AI tools.
MagicPath
The canvas is infinite, and exploration is becoming the workflow. How are you using MagicPath?
creativeaiflow
Creative AI workflows are evolving. What tools do you use, and what are their strengths and weaknesses?
freelancerlife
Freelancer life is wins, pivots, and everything in between. What’s yours right now?