The network for creativity
Join 1.25M professional creatives like you
Connect with clients, get discovered, and run your business 100% commission-free
Creatives on Contra have earned over $150M and we are just getting started
Back to feedPost


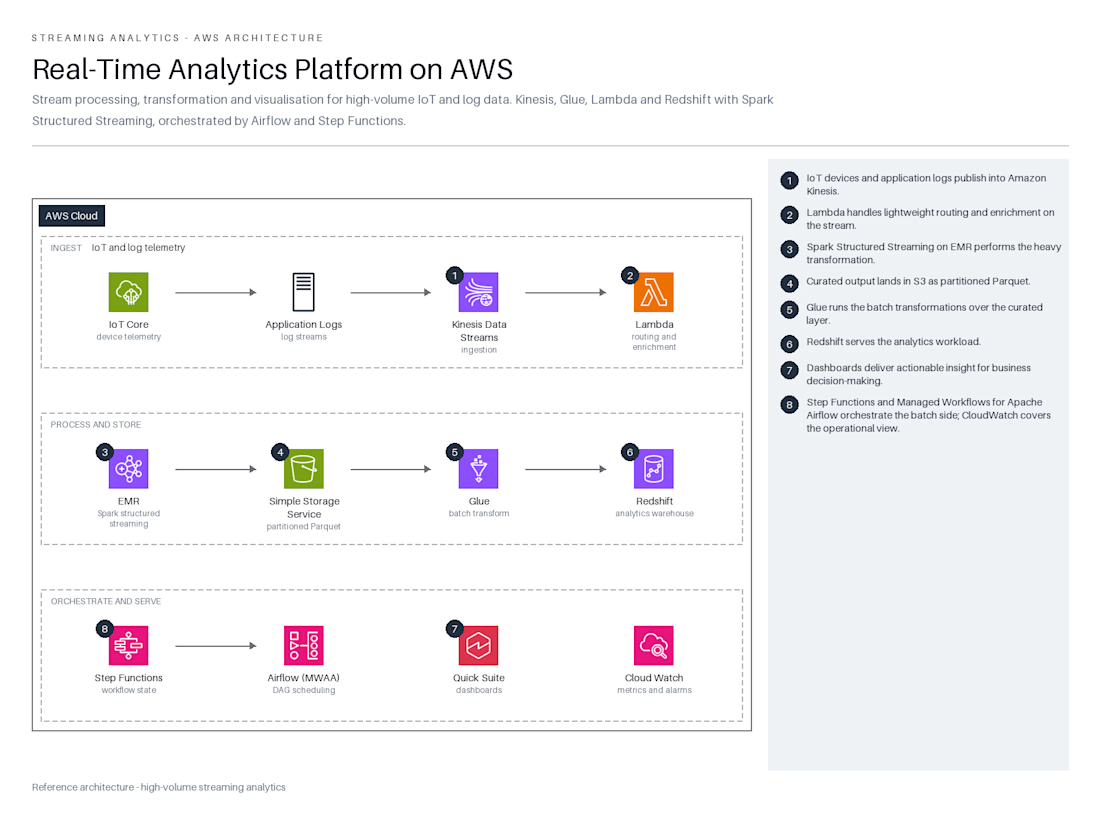
Real-Time Analytics Platform on AWS designed to ingest, process, and visualize high-volume streaming data from IoT devices and application logs.
Ingestion: Device telemetry (IoT Core) and application logs are published into Amazon Kinesis Data Streams, followed by lightweight routing and enrichment using AWS Lambda.
Processing & Storage: Amazon EMR performs heavy data transformations via Spark Structured Streaming, landing the curated output into Amazon S3 as partitioned Parquet files. AWS Glue then handles batch transformations before loading the data into Amazon Redshift for the analytics workload.
Orchestration & Serving: AWS Step Functions coordinate the batch processing workflows. Finally, Amazon QuickSight generates actionable business dashboards while Amazon CloudWatch monitors operational metrics and alarms


The network for creativity
Join 1.25M professional creatives like you
Connect with clients, get discovered, and run your business 100% commission-free
Creatives on Contra have earned over $150M and we are just getting started
Related posts

Business data often lives across payment, analytics, CRM, advertising, and inventory platforms. Metrik brings those signals together in one dashboard built for startups and small businesses.
See revenue, orders, customers, and business health at a glance. Compare advertising spend and ROAS across channels, explore visual KPI cards, and use smart alerts to spot unusual changes and potential risks.
The interface pairs a clean layout and rounded components with soft gradients, colorful analytics, and clear visual hierarchy, helping make business performance easier to follow.


This interactive dashboard provides a comprehensive view of profit performance across multiple dimensions—time, segments, regions, categories, and sub‑categories.
This dashboard transforms raw business data into actionable insights by allowing stakeholders to quickly identify profitable areas, spot regional trends, and evaluate category performance. It’s designed for clarity, interactivity, and decision‑making support.


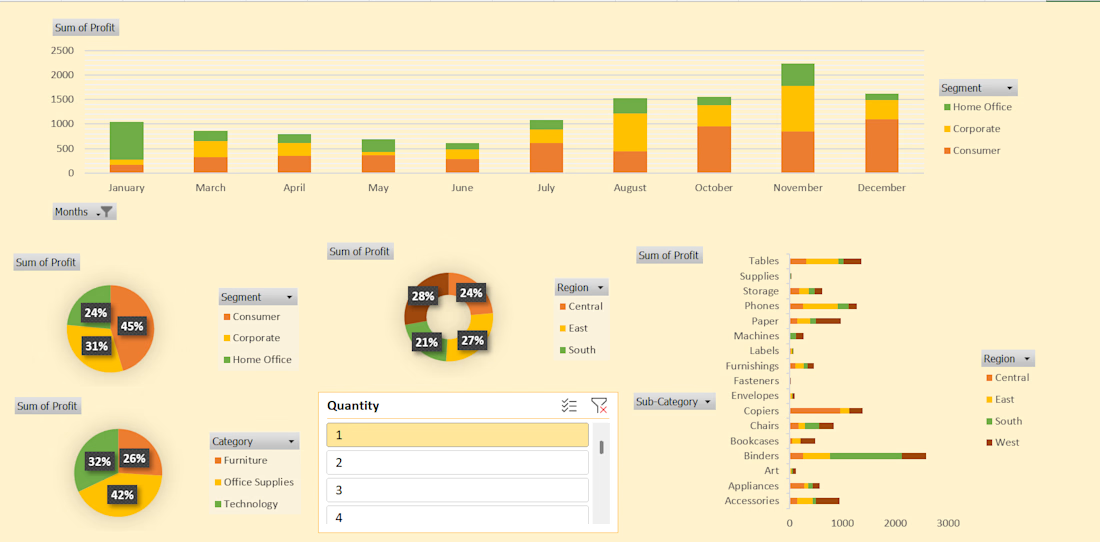
#This is an excellent Profit Dashboard which is made in MS Excel with multiple creative functions help in understanding Monthly , Yearly , Area wise Profits.

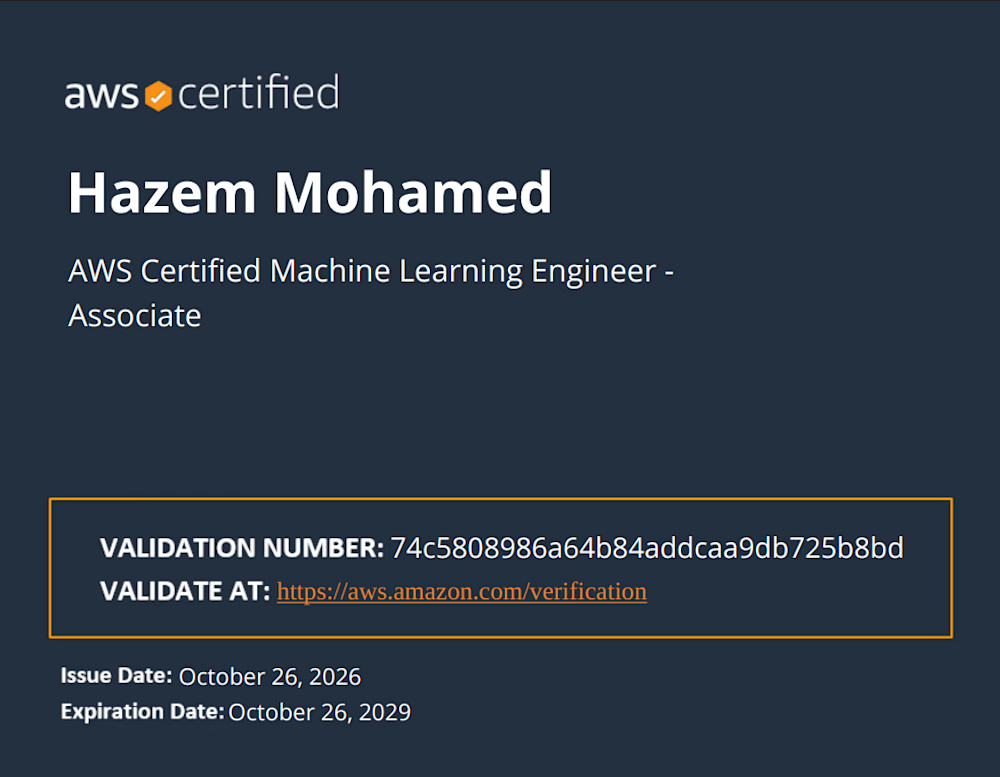
Proud to officially add the AWS Certified Machine Learning Engineer - Associate certification to my toolkit!
Building robust machine learning pipelines and scaling AI workloads securely on the cloud has always been a key focus of mine. Earning this certification has been a great deep-dive into mastering AWS ML infrastructure, MLOps best practices, and production-grade architectures.
Ready to bring these advanced capabilities to upcoming data science and engineering projects! Let's build something impactful. 💡💪
🔗 Verify Certificate:
Validation Number: 74c5808986a64b84addcaa9db725b8bd
Verification Link: https://aws.amazon.com/verification
#AWS #MachineLearning #AI #CloudComputing #DataAnalysis #MLOps


Congratulations on earning the AWS Machine Learning Engineer certification, Hazem khaled! Robust pipelines and cloud automation make all the difference for production-grade AI systems.