The network for creativity
Join 1.25M professional creatives like you
Connect with clients, get discovered, and run your business 100% commission-free
Creatives on Contra have earned over $150M and we are just getting started
Back to feedPost

Shopify Store Performance & Sales Analytics
This project showcases a Shopify analytics dashboard displaying key e-commerce performance metrics, including total sales, online store sessions, conversion rates, average order value, and sales trends.
The dashboard presents business data through clear charts and performance summaries, making it easier to monitor store activity and understand sales performance over time.
Key Highlights
Sales and revenue tracking
Online store traffic and sessions
Conversion rate monitoring
Average order value analysis
Sales trends and performance reporting
The goal is to make e-commerce data easier to understand and help store owners identify areas for further analysis and improvement.


The network for creativity
Join 1.25M professional creatives like you
Connect with clients, get discovered, and run your business 100% commission-free
Creatives on Contra have earned over $150M and we are just getting started







Related posts

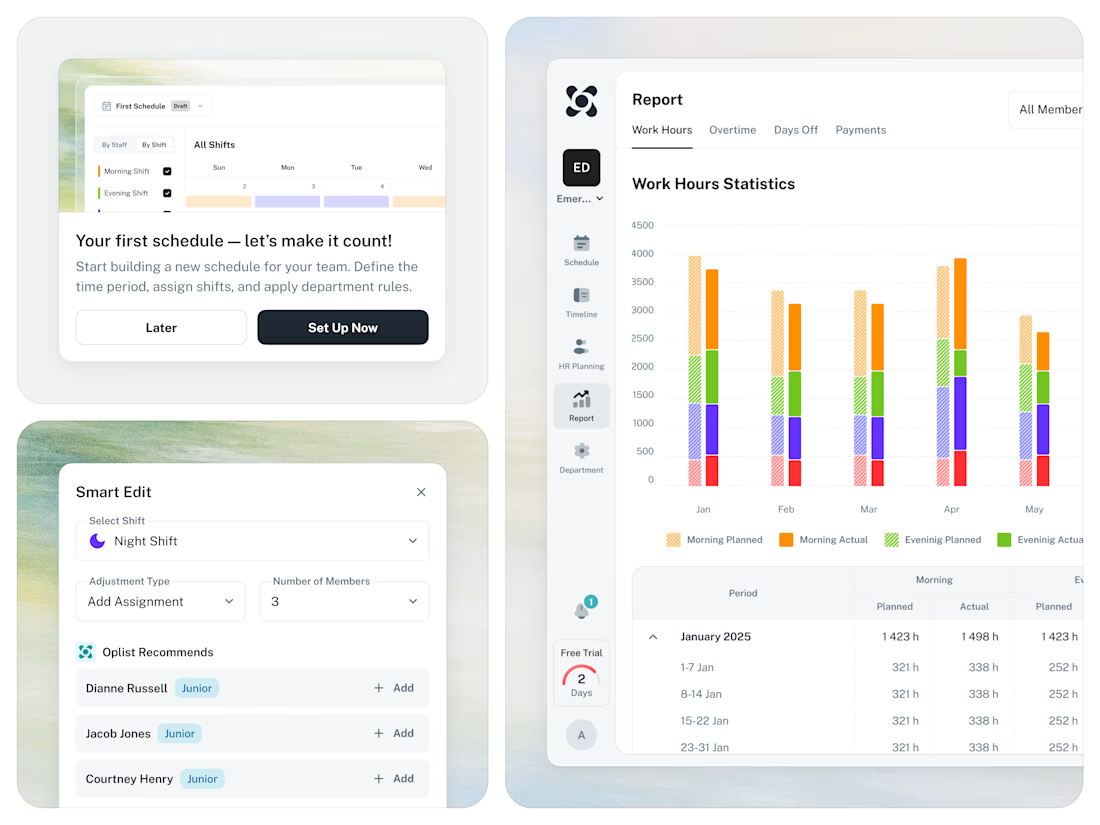
🚀 From Excel chaos to a clear SaaS workflow for staff scheduling.




GoTeacher found our Sunbeam template and asked us to make it theirs.
GoTeacher is backed by Harvard Innovation Labs and helps 100+ K-12 school districts see every app they pay for and whether it's safe for student data.
We kept Sunbeam's structure and animations and built the rest: GoBot the 3D mascot, shader clouds, real product dashboards and five product pages. Live in one week.
Full case study on my profile. Want one of our templates turned into your own site? Message me.


The work is interesting

Same landing page, two passes on the surface.
Which one feels more finished?
6 voted
23%

20 voted
77%

26 votes
Closed

B is has more professional image 👍❤️


