The network for creativity
Join 1.25M professional creatives like you
Connect with clients, get discovered, and run your business 100% commission-free
Creatives on Contra have earned over $150M and we are just getting started
Back to feedPost

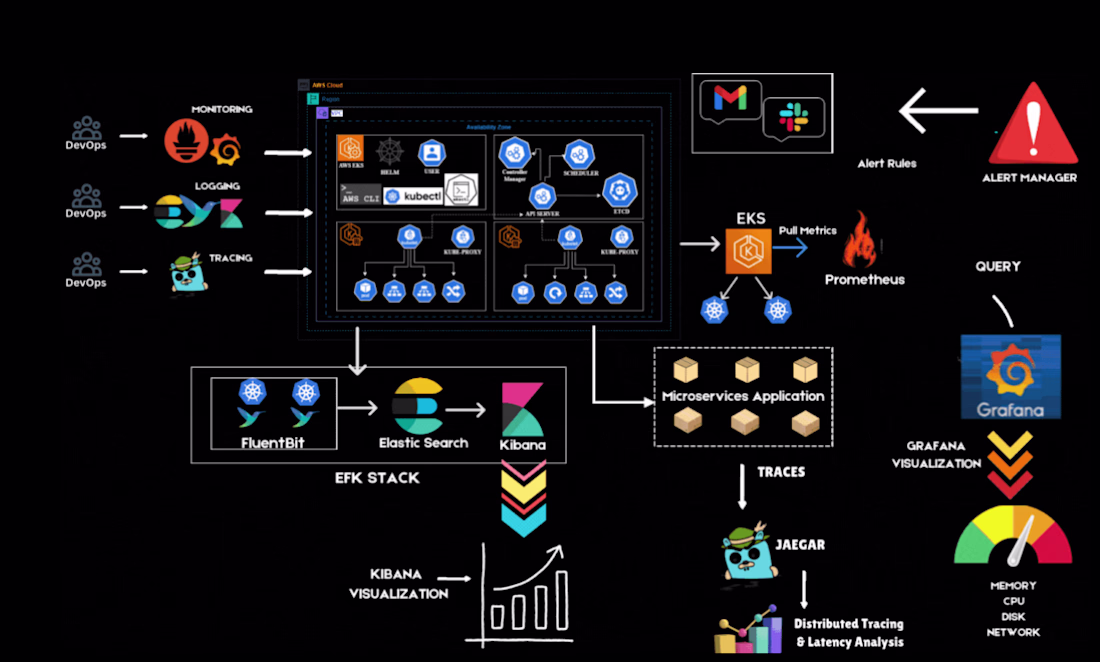
Infrastructure Monitoring with Prometheus & Grafana
Description:
Implemented real-time monitoring dashboards
Collected infrastructure metrics using Prometheus
Visualized performance insights with Grafana dashboards
Tech Stack:
Prometheus • Grafana • Alertmanager • Kubernetes


The network for creativity
Join 1.25M professional creatives like you
Connect with clients, get discovered, and run your business 100% commission-free
Creatives on Contra have earned over $150M and we are just getting started
Related posts

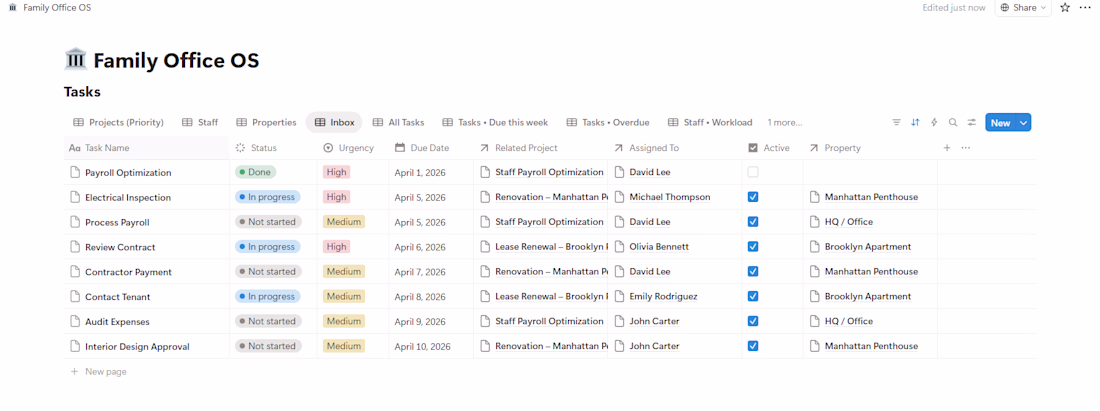
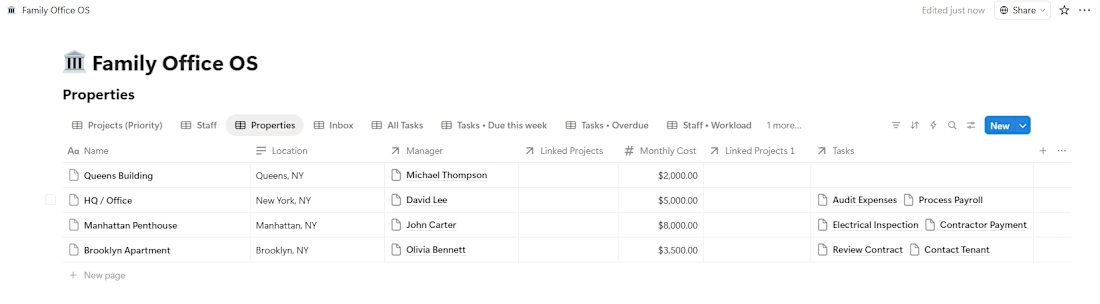
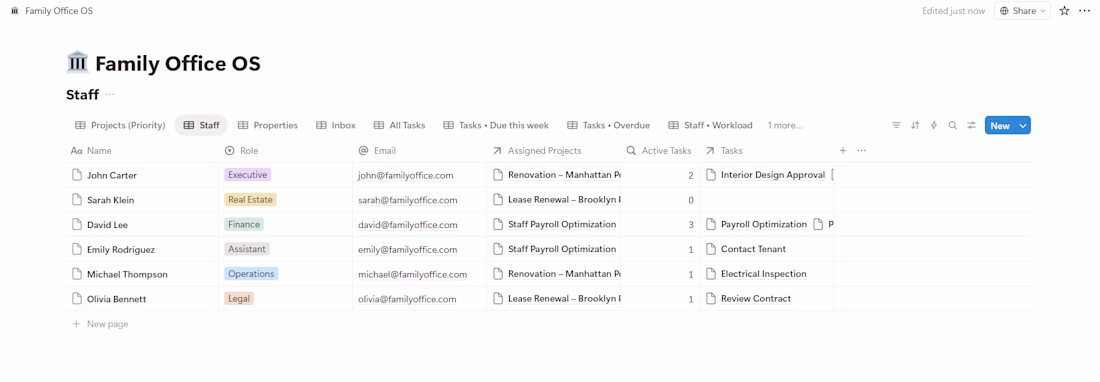
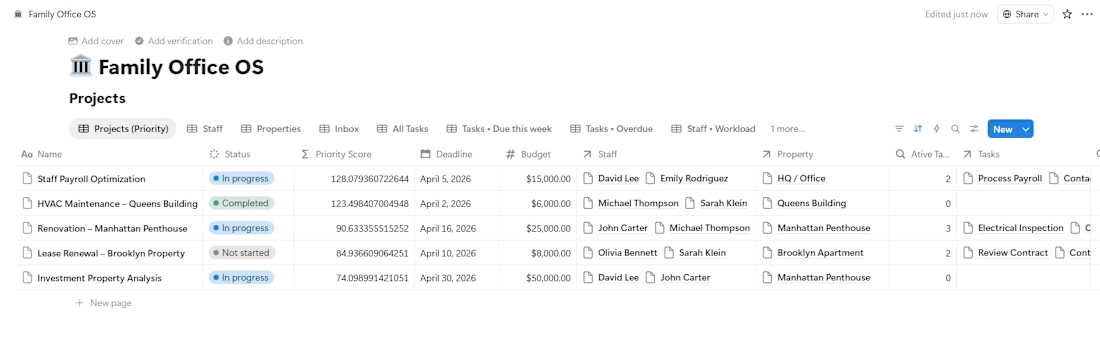
Built a fully connected Notion OS designed for managing operations in a multi-property environment.
The system links Projects, Staff, Properties, and Tasks into a single structure, with rollups and relations that provide real-time visibility on workload, priorities, and deadlines.
It allows you to track who is responsible for each task, monitor project progress, and quickly identify overdue or high-priority items.
Designed to support ongoing operations, not just task tracking — including workload management and centralized oversight.


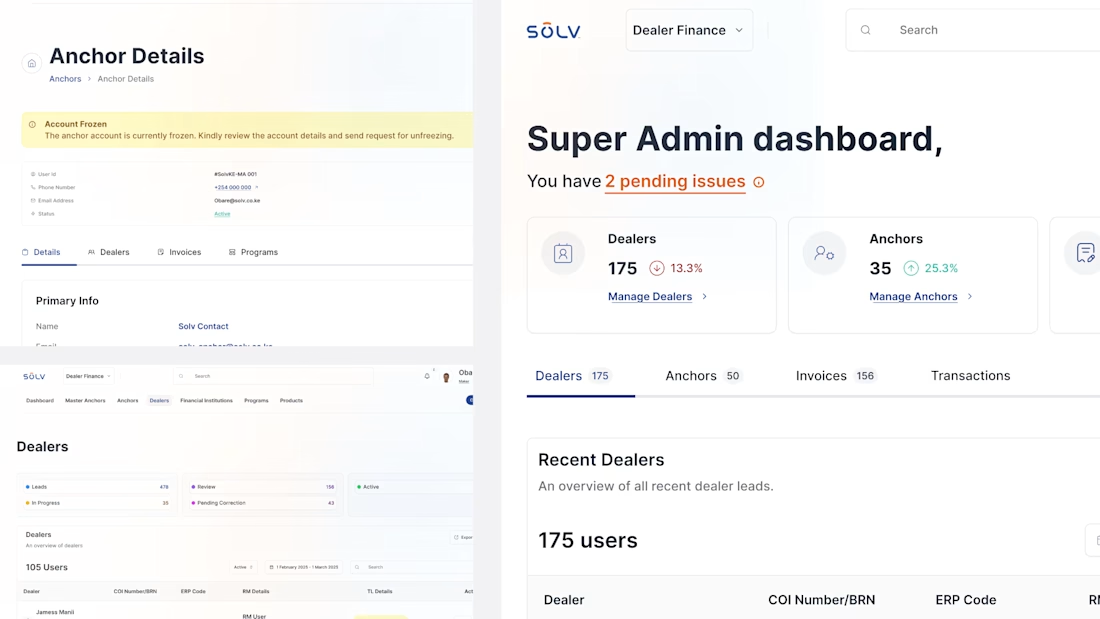
Led the comprehensive redesign of the Solv management dashboards, transforming a complex back-office system into a high-performance administrative suite. I architected an extensive ecosystem of over 200 screens focused on data density and operational efficiency, providing administrators with a centralized command center to oversee loan
processing, credit lines, and system-wide financial analytics for the Kenyan market.


Trending


Notion
Notion isn’t just where you work, it’s starting to work for you. What agents are you building?
portfolioreview
The best portfolios tell a story, not just show a grid. Share yours for feedback.
brandguidelines
Brand guidelines are becoming living systems, not static documents. What are you building for your clients?
aivideo
AI video tools are moving at warp speed. Which ones are you experimenting with?
freelancerlife
Freelancer life is wins, pivots, and everything in between. What’s yours right now?