The network for creativity
Join 1.25M professional creatives like you
Connect with clients, get discovered, and run your business 100% commission-free
Creatives on Contra have earned over $150M and we are just getting started
Back to feedPost

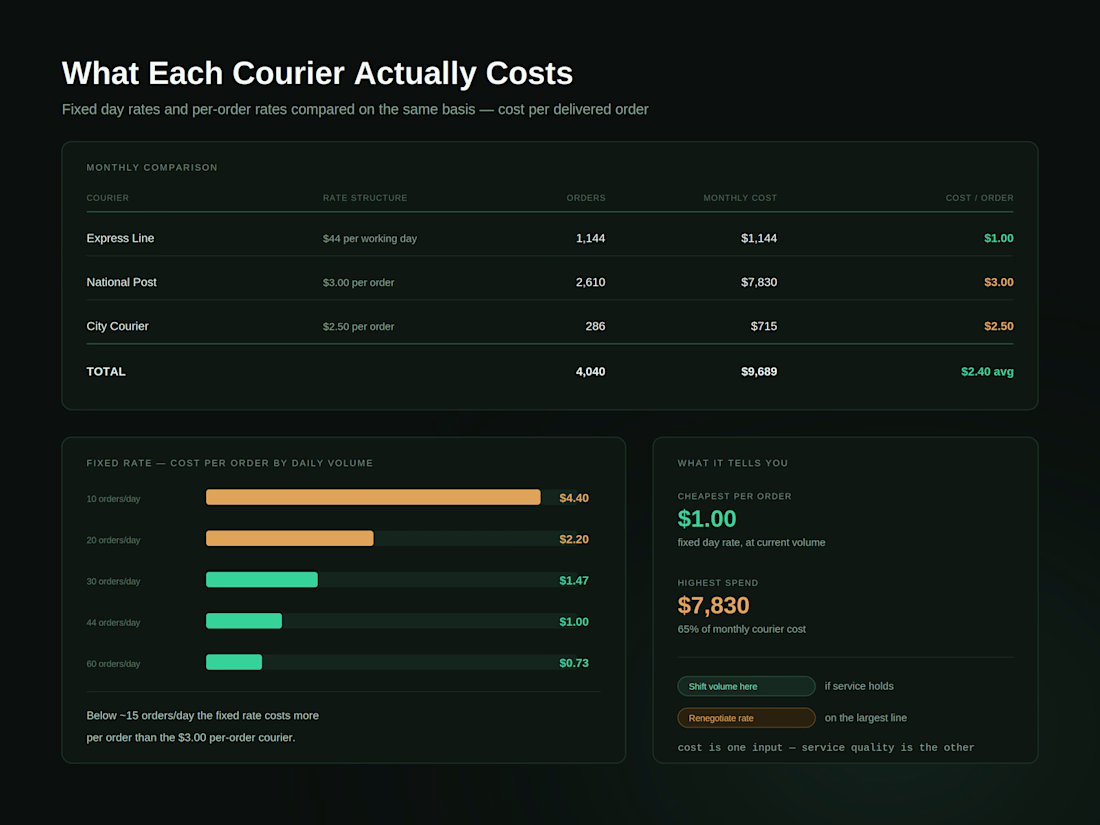
Couriers charge in different ways, one on a fixed daily rate, others per order which makes it hard to tell which is actually cheaper. The rates aren't comparable until you convert them to the same measure.
Since the daily dispatch report already tracked how many orders each courier handled, I used it to work out the real cost per delivered order for each one, month by month.
That reframes the fixed daily rate as a volume question: it's the cheapest option at high volume and the most expensive at low volume, with a clear break-even point. It also shows which courier accounts for the largest share of spend, which is where a rate negotiation is worth having.
Cost is only one input. Service quality, delivery speed, handling, and how reliably cash is returned, matters just as much, so the cost figure informs the decision rather than making it.


The network for creativity
Join 1.25M professional creatives like you
Connect with clients, get discovered, and run your business 100% commission-free
Creatives on Contra have earned over $150M and we are just getting started




Related posts

📊 Interactive Sales Analytics Dashboard in Excel
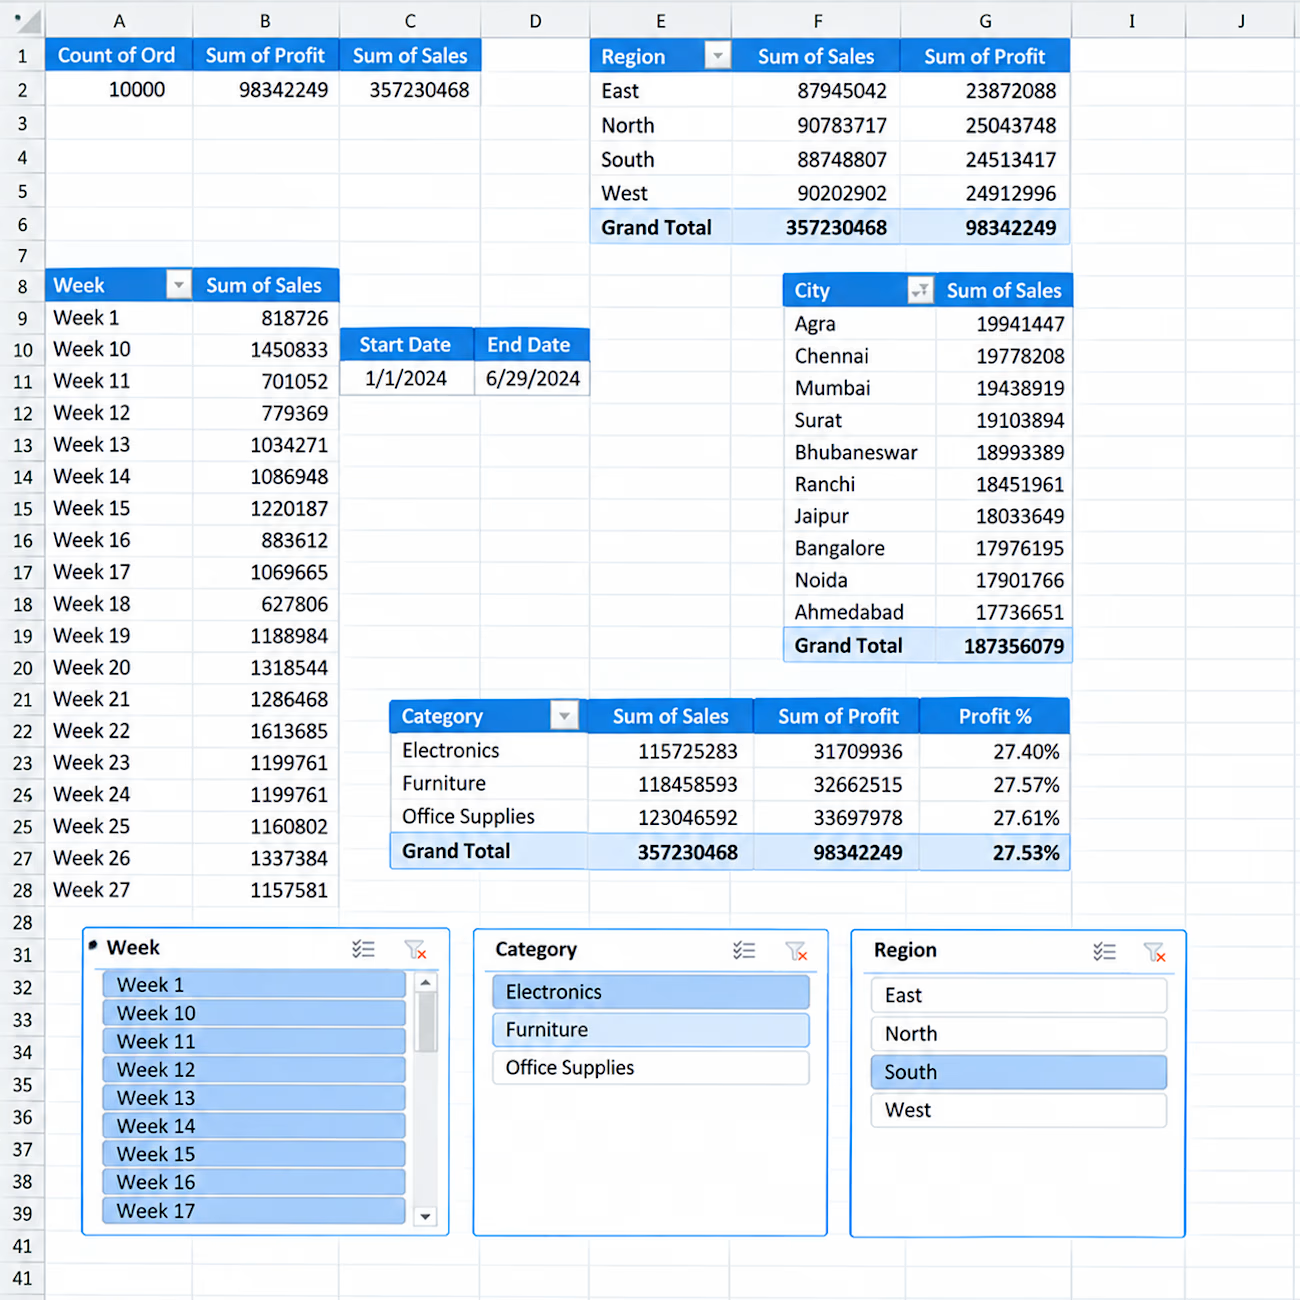
I created an interactive Excel dashboard to analyze sales performance across different business dimensions.
Key Insights & Features:
• Total Orders, Sales & Profit KPIs
• Sales & Profit by Region
• Sales by City
• Category-wise Sales, Profit & Profit %
• Weekly Sales Analysis
• Interactive Slicers for Week, Category & Region
• Start Date & End Date tracking
• PivotTable-based analysis
This dashboard is designed to turn raw sales data into clear and actionable business insights using Excel.

Hello.
I guess we're in the same page about data analysis and visualization

You Will Get Apollo + LinkedIn Sales Navigator B2B Leads, Verified Emails & Direct Phone Numbers.
Need targeted B2B leads with accurate contact information for your sales or outreach?
What You Provide:
✔Target industry / niche
✔Location
✔Company size or other filters
✔Decision-maker titles
✔Or your Apollo / LinkedIn Sales Navigator search link
What I Do:
I research and qualify the right companies and decision-makers, then enrich the prospects with:
✔Verified business emails
✔Direct phone / mobile numbers
✔LinkedIn profiles
✔Job titles
✔Company information
I also verify, clean, and remove duplicates before delivery.
What You Receive:
Company • Contact Name • Job Title • LinkedIn • Verified Email • Direct Phone • Website
Why Choose Me:
✓ Targeted B2B research
✓ Multiple data sources
✓ Manual data checking
✓ Email & contact verification
✓ Clean, organized, outreach-ready data
Tools: Apollo • LinkedIn Sales Navigator • Lusha • ContactOut • SalesQL • Google Sheets
Ready to Get Started?
Send me your target requirements or Apollo / Sales Navigator search link, and I can start with a small sample.


good work

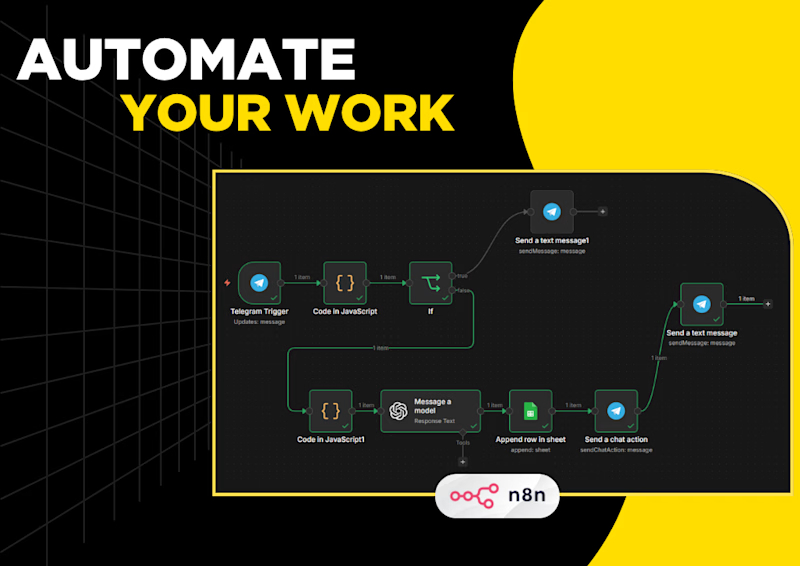
Problem: You spend too much time answering customers manually and lose track of conversations.
Which solution is best suited for your business?


0 voted
0%
5 voted
100%
5 votes
Closed