The network for creativity
Join 1.25M professional creatives like you
Connect with clients, get discovered, and run your business 100% commission-free
Creatives on Contra have earned over $150M and we are just getting started
Back to feedPost

AuraSaaS: Revenue Analytics Dashboard
A dark-mode analytics screen for a subscription SaaS product. It shows a team’s revenue health at a glance and points them toward the next growth opportunity.
Layout and navigation: A fixed left sidebar holds the workspace switcher (Acme Cloud Corp, Enterprise Plan) and the main navigation: Dashboard, Analytics, Customers, Subscriptions and Invoices. Integrations and Settings sit under a separate Configurations group. At the bottom are an API usage meter (84.2% of the monthly quota) with an “Upgrade Quota” call to action, and the user profile. The top bar has global search with a ⌘K shortcut, a date-range filter, Export, notifications and a primary “Add Customer” button.
Key metrics: Four KPI cards lead the page: Net Revenue Retention (118.4%), Customer Lifetime Value ($8,420), CAC Payback Period (6.2 months) and Expansion MRR ($21.8k). Each has a trend indicator in green and a short line of context, such as “Top quartile for B2B SaaS”, so the numbers read as insight rather than raw data.
Data visualization: The MRR composition chart shows steady month-over-month growth from January to November. The latest month is highlighted with a bright violet gradient so the eye lands on the current period. Beside it, a Plan Performance panel breaks revenue down by tier (Enterprise 56%, Pro Growth 31%, Starter 13%) using color-coded progress bars.
Actionable insight: A “Growth opportunity” card calls out that 142 Pro accounts are approaching Enterprise usage limits, with a “View accounts” link. This turns the dashboard from a reporting tool into one that prompts action.
Visual design: A deep navy base with indigo and violet accents, green for positive signals, rounded cards with subtle borders, and clear typographic hierarchy. The result is a modern, focused interface that keeps dense data readable.

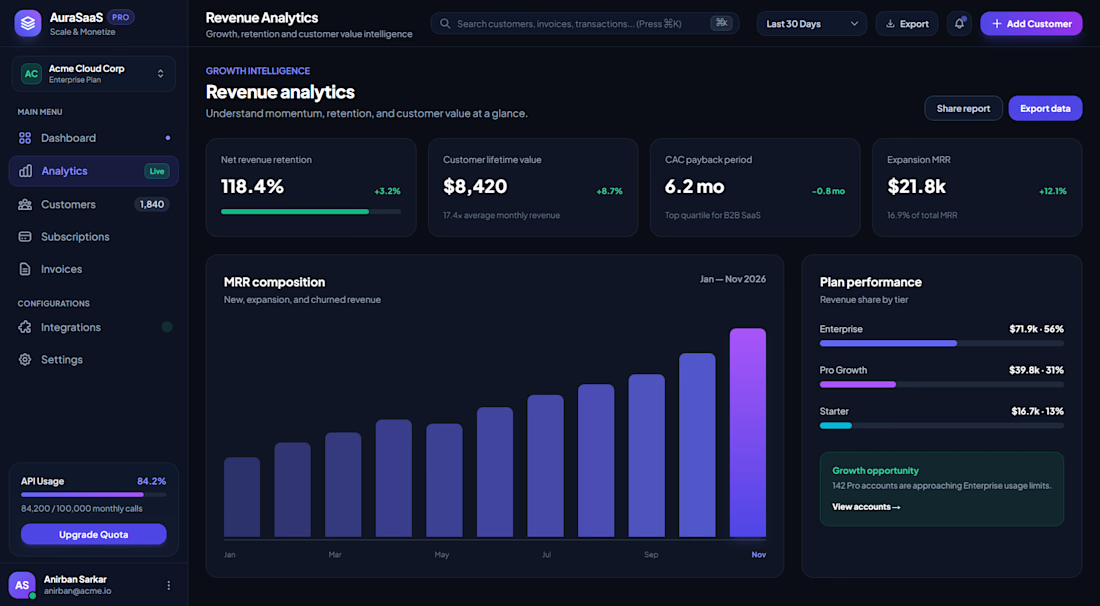

Clean dashboard layout.
The network for creativity
Join 1.25M professional creatives like you
Connect with clients, get discovered, and run your business 100% commission-free
Creatives on Contra have earned over $150M and we are just getting started



Related posts

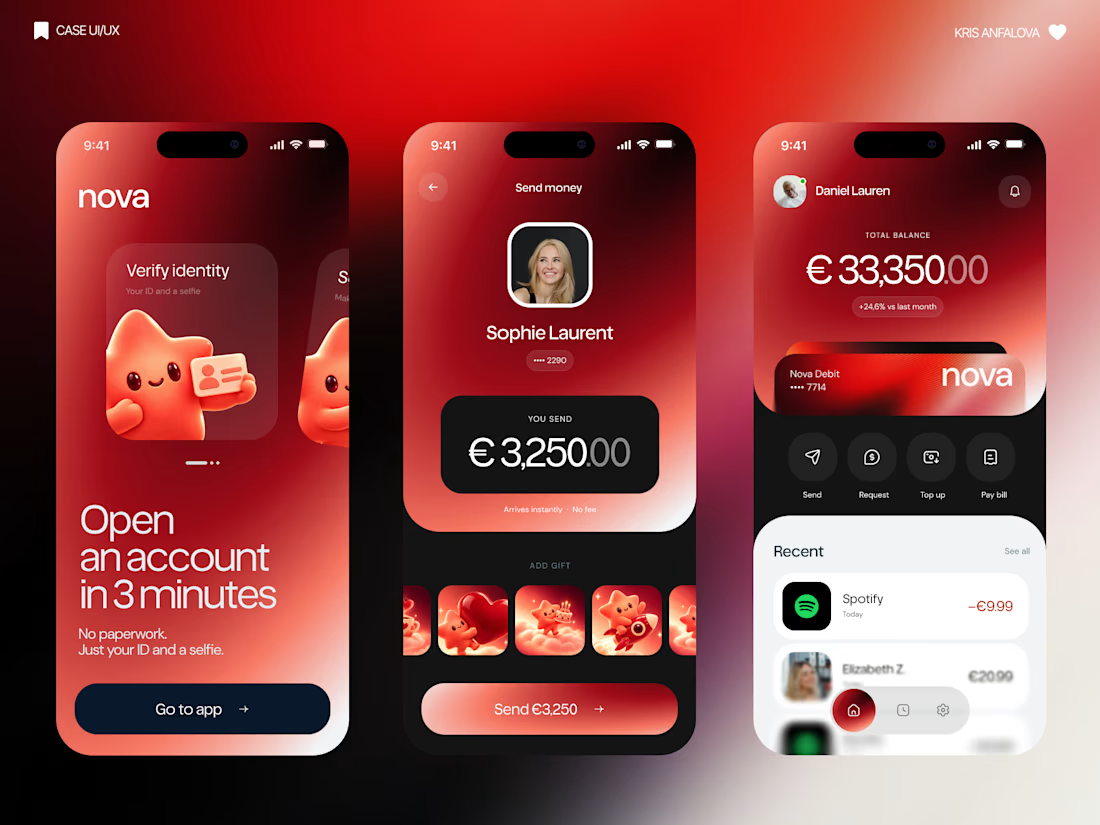
What if sending money felt a little more like giving a gift?
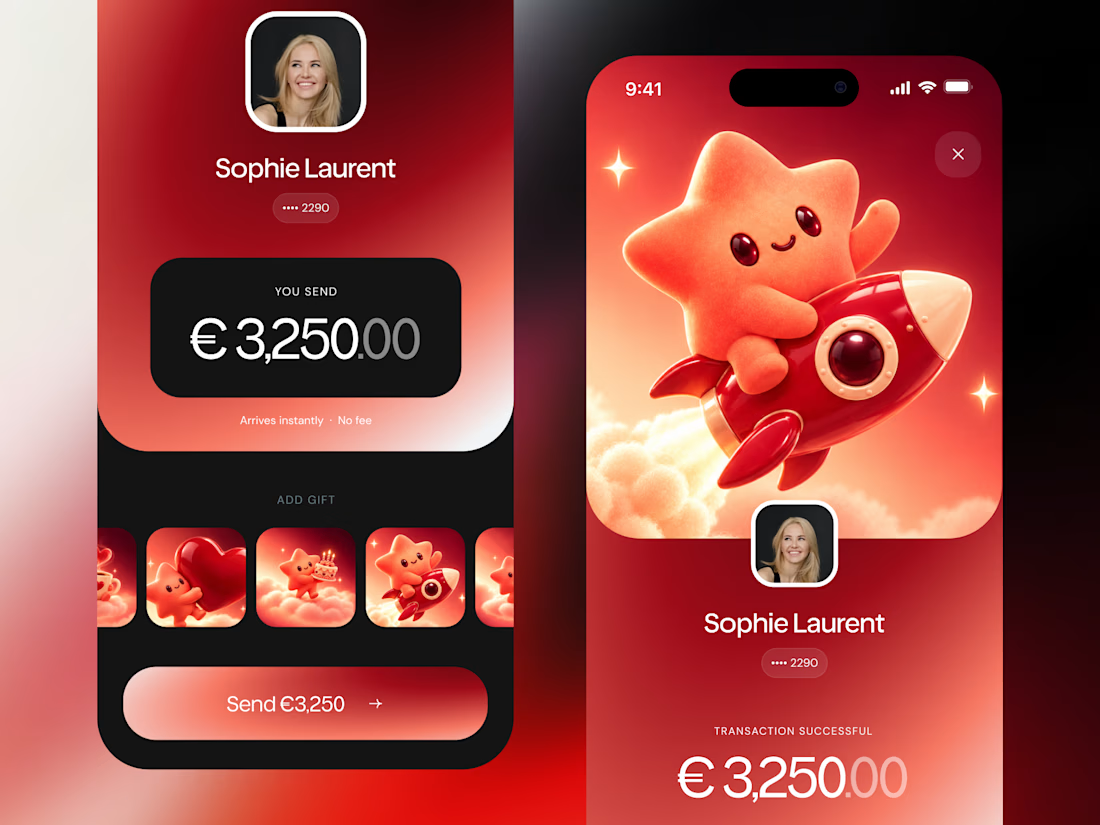
For Nova, I explored a banking app that brings payments, cards, and a bit of personality together. You can check your balance, browse recent transactions, send or request money, top up, and pay bills.
My favorite part is the digital postcard feature. Before sending a transfer, you can add a little illustrated card—a heart, a birthday greeting, or a playful character. A simple way to make birthday money or a thank-you feel more personal.
I carried that same 3D character into onboarding, pairing it with bold red gradients and large, clear payment details. There’s room for play, while the recipient and amount stay easy to check.
Would you add a postcard to a transfer? I’d love to know what occasion you’d use it for.




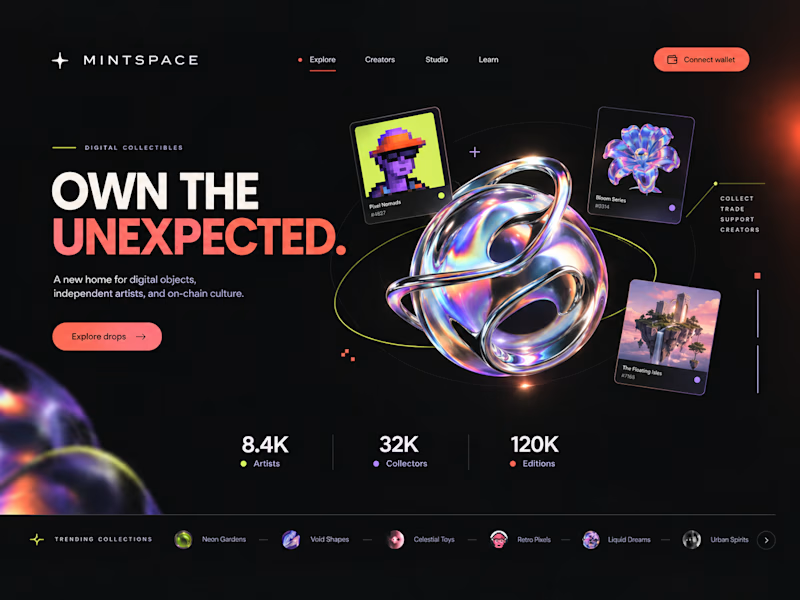
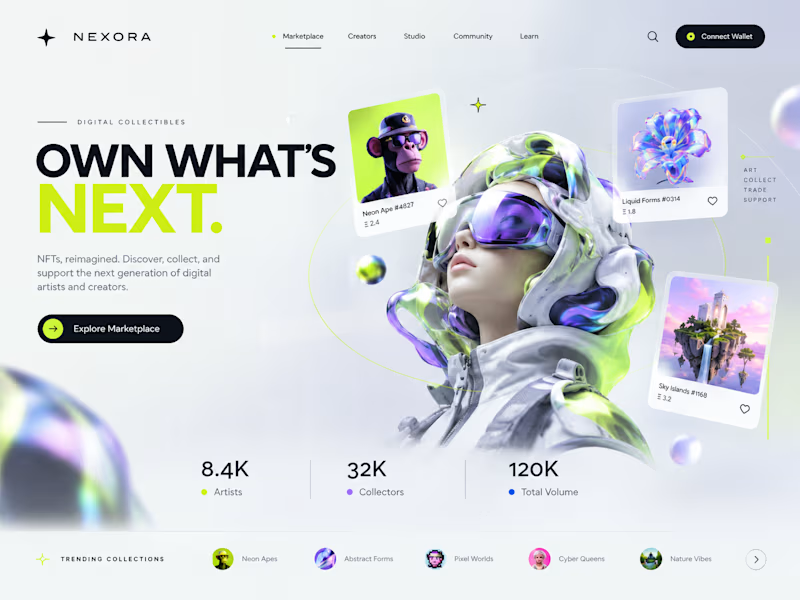
Two directions. One NFT marketplace.
Which visual direction would you choose?
🖤 A — Dark & Futuristic
🤍 B — Bright & Minimal
Both explore the future of Web3, but with completely different visual identities.
Drop your vote in the comments: A or B?
#UIUXDesign #WebDesign #NFT #Web3 #ProductDesign
10 voted
29%
25 voted
71%
35 votes
Closed

Strong design, well done

2nd variation of a landing page for a B2B search analytics platform
For this variation, I went with a lighter background where the CTA is visually focused instantly.
You might have 3~5 seconds to get the user's attention, so it's very important how the design looks and feels.
Full landing page coming tomorrow.

