The network for creativity
Join 1.25M professional creatives like you
Connect with clients, get discovered, and run your business 100% commission-free
Creatives on Contra have earned over $150M and we are just getting started
Back to feedPost
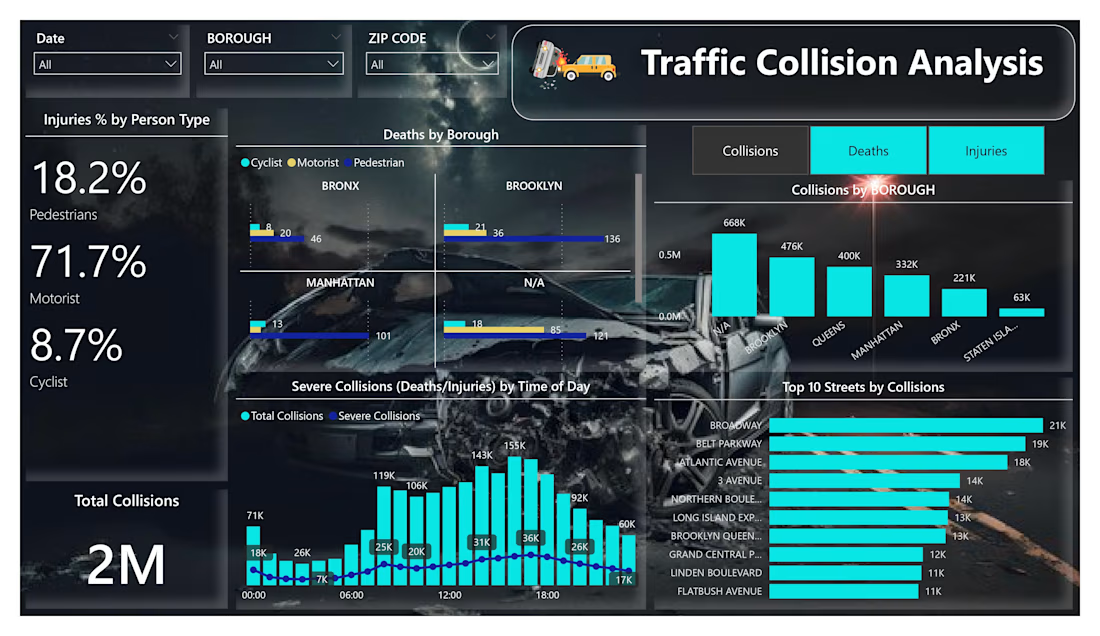
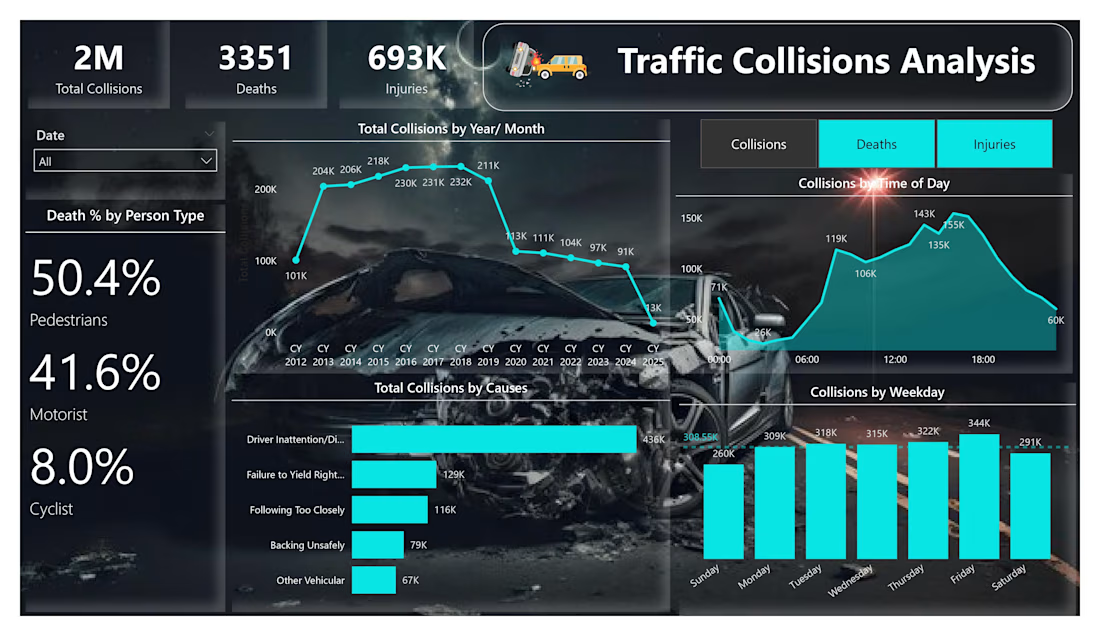
NYC Traffic Collision Analysis Dashboard
Client/Project Type: Data Analytics · Urban Planning
Project Overview
Analyzed over 2 million traffic collisions in NYC to identify high-risk areas, times, and affected groups, supporting data-driven safety interventions.
What I Delivered
◼ Interactive Power BI dashboard with filters for location and time
◼ Top 10 high-risk streets (Broadway leading with 21K+ collisions)
◼ Injury breakdown: 71.7% motorists, 18.2% pedestrians, 8.7% cyclists
◼ Peak severe collision times: 12:00–18:00
◼ Borough-level analysis, with Brooklyn having the most collisions (668K)
Tools: Power BI, Data Analysis, Visualization
#TrafficSafety #UrbanAnalytics #DataVisualization #NYC #PowerBI #PublicSafety #DataForGood
The network for creativity
Join 1.25M professional creatives like you
Connect with clients, get discovered, and run your business 100% commission-free
Creatives on Contra have earned over $150M and we are just getting started
Related posts
SaaS Dashboard with real-time data visualization 📊
Built with Rive micro-interactions ✨
#wonderchallenge #rive #saas
clean and keen always win
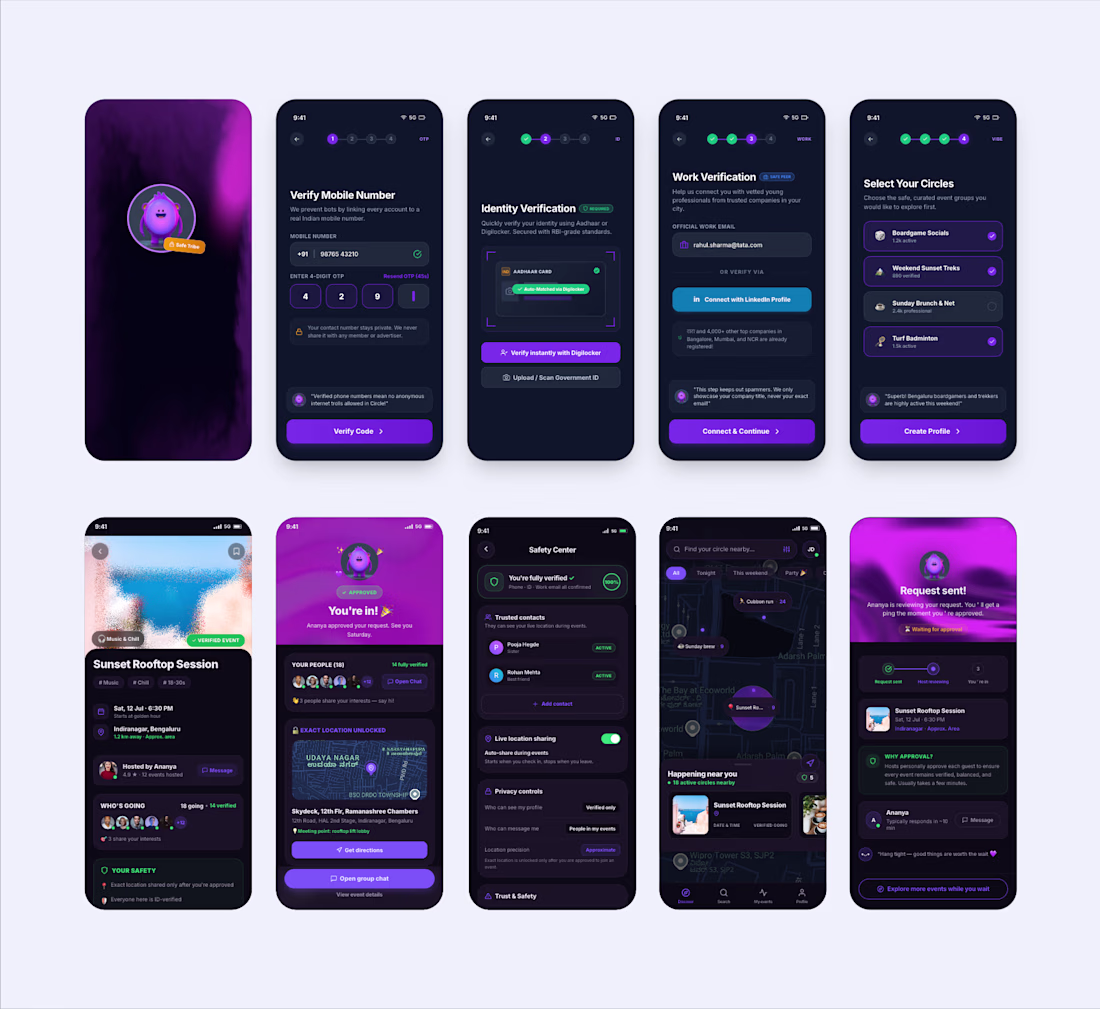
Circle — Safety-First Event Discovery App
Bangalore hosts 18,000+ events a year. yet young
professionals, especially women, hesitate to attend.
The problem isn't event supply. It's trust.
Circle is my answer: an event discovery app where
safety isn't a settings page. it's the design itself.
THE CORE IDEA
The map never shows exact locations. Events appear as
soft glowing zones approximate areas, not pins. The
precise venue unlocks only after the host approves your
request. You can see the privacy working before you
read a word.
WHAT I DESIGNED
→ 11 screens: verified onboarding (phone + DigiLocker
ID + work email), map-first discovery, event detail
with safety signals, host-approval gate, and a full
Safety Center with trusted contacts and SOS
→ Circlo: a companion mascot who coaches users through
verification and celebrates their moments, turning
compliance steps into a warm journey
→ Research-backed: 46% of surveyed Indian women view
verified apps as safer than real-life encounters.
Verification is the acquisition strategy, not friction.
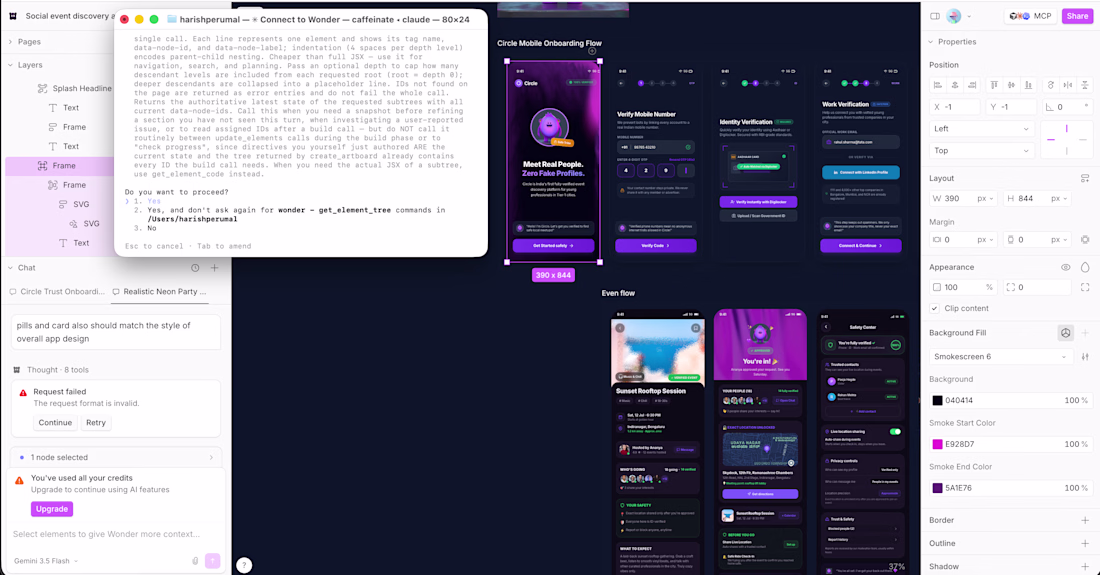
HOW WONDER CHANGED THE WORKFLOW
Every screen was generated through Wonder Chat, styled
with Wonder's shader library, then pushed through
Wonder's MCP directly into working React code. No
handoff. No redlines. The design IS the code.
That last part is the shift: I watched my design file
become a running app in one step.
Built in one week for the Wonder Design Challenge.
Trending
Claude
Claude has entered the design space. How are you using Claude Design?
Contra University
Learn from expert creatives how to earn more using next-gen AI tools.
fifaworldcup2026
The World Cup is here and the whole world's watching. How are you designing for the world stage?
creativeaiflow
Creative AI workflows are evolving. What tools do you use, and what are their strengths and weaknesses?
freelancerlife
Freelancer life is wins, pivots, and everything in between. What’s yours right now?