The network for creativity
Join 1.25M professional creatives like you
Connect with clients, get discovered, and run your business 100% commission-free
Creatives on Contra have earned over $150M and we are just getting started
Back to feedPost

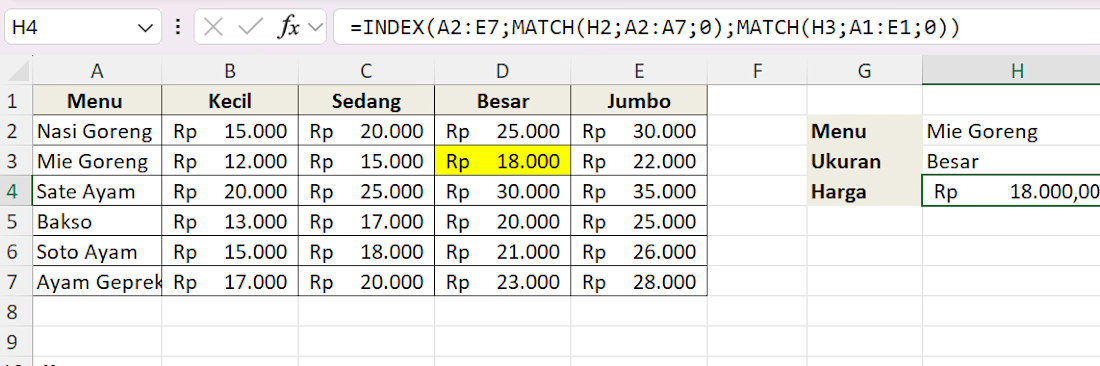
Searching data manually in a matrix table with multiple criteria is inefficient. A two-way INDEX & MATCH function is the perfect solution for dynamic retrieval:
Row Match: Automatically locates the specific food item (e.g., "Mie Goreng") vertically.
Column Match: Identifies the correct portion size (e.g., "Besar") horizontally.
Dynamic Result: The INDEX function intersects both criteria to instantly retrieve the exact price.

The network for creativity
Join 1.25M professional creatives like you
Connect with clients, get discovered, and run your business 100% commission-free
Creatives on Contra have earned over $150M and we are just getting started





Related posts

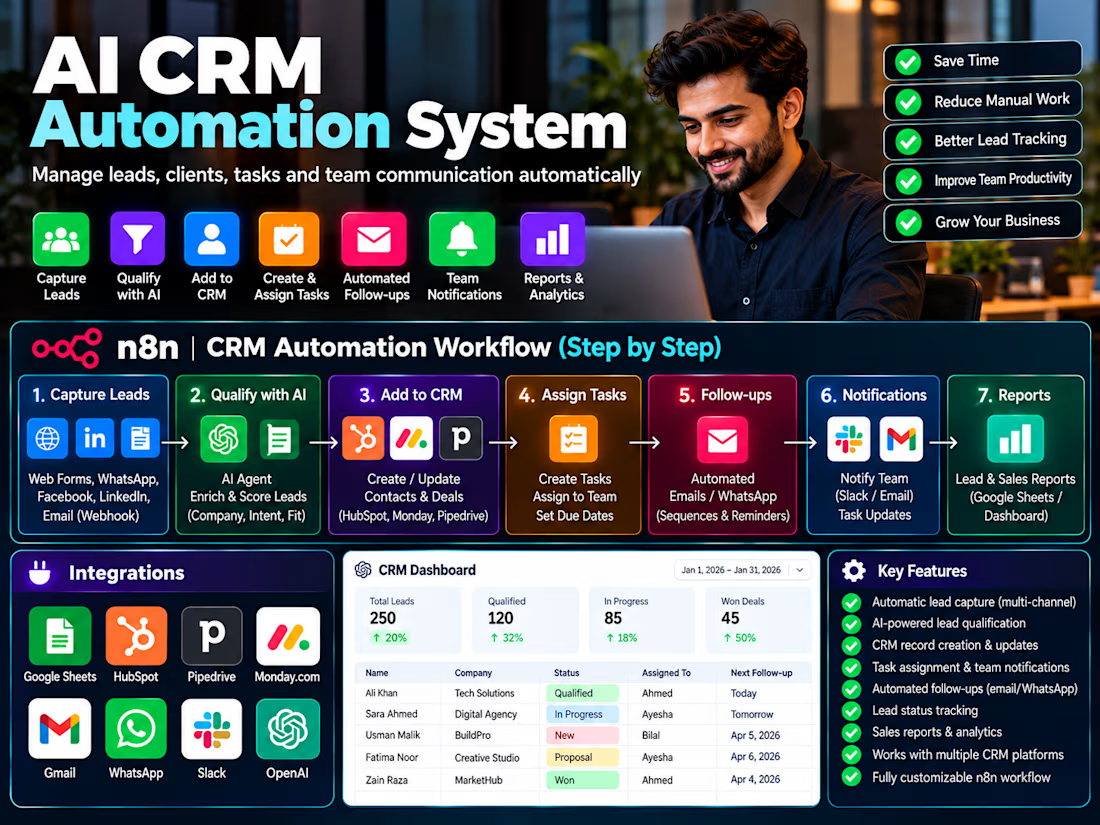
Built an n8n CRM automation system that captures leads, creates and updates CRM records, assigns tasks, sends team notifications, automates follow-ups and generates reports.


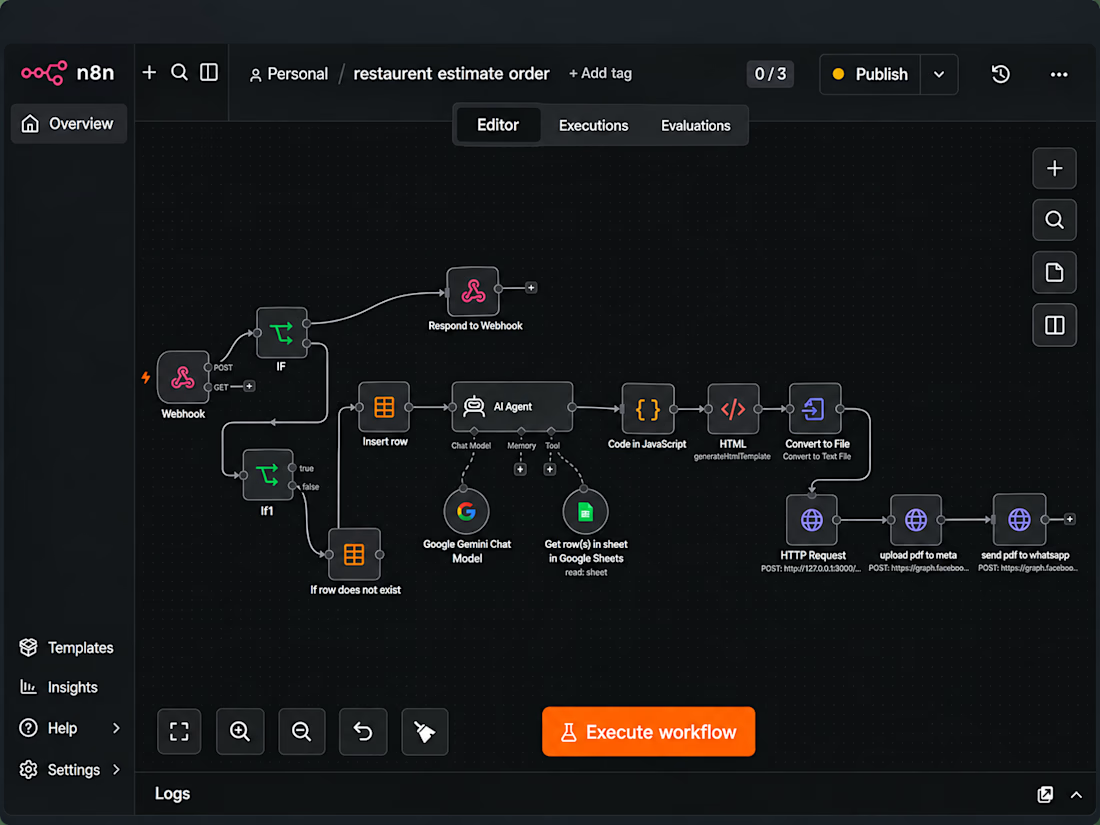
Restaurant Automation System. Automates WhatsApp orders, menu & pricing lookup, estimate generation, PDF invoices, and order processing using n8n, Google Sheets, Gemini AI and WhatsApp Cloud API.



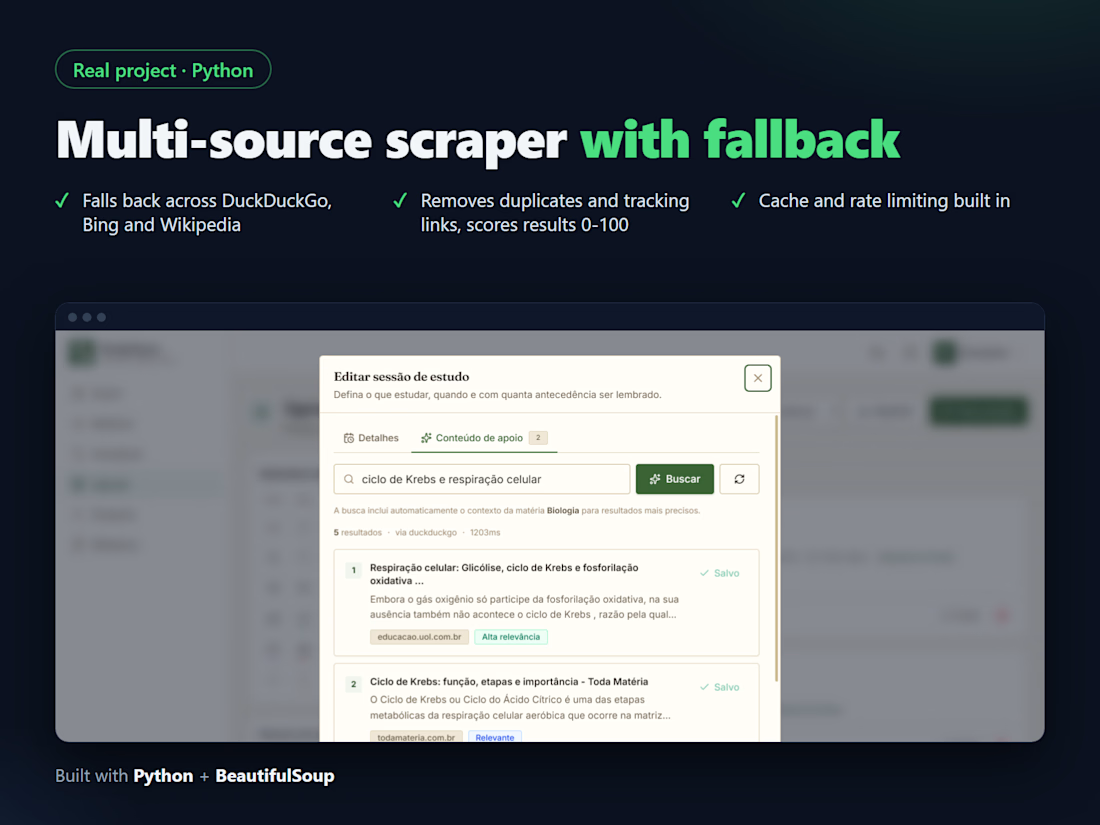
Multi-source web scraper with fallback