The network for creativity
Join 1.25M professional creatives like you
Connect with clients, get discovered, and run your business 100% commission-free
Creatives on Contra have earned over $150M and we are just getting started
Back to feedPost
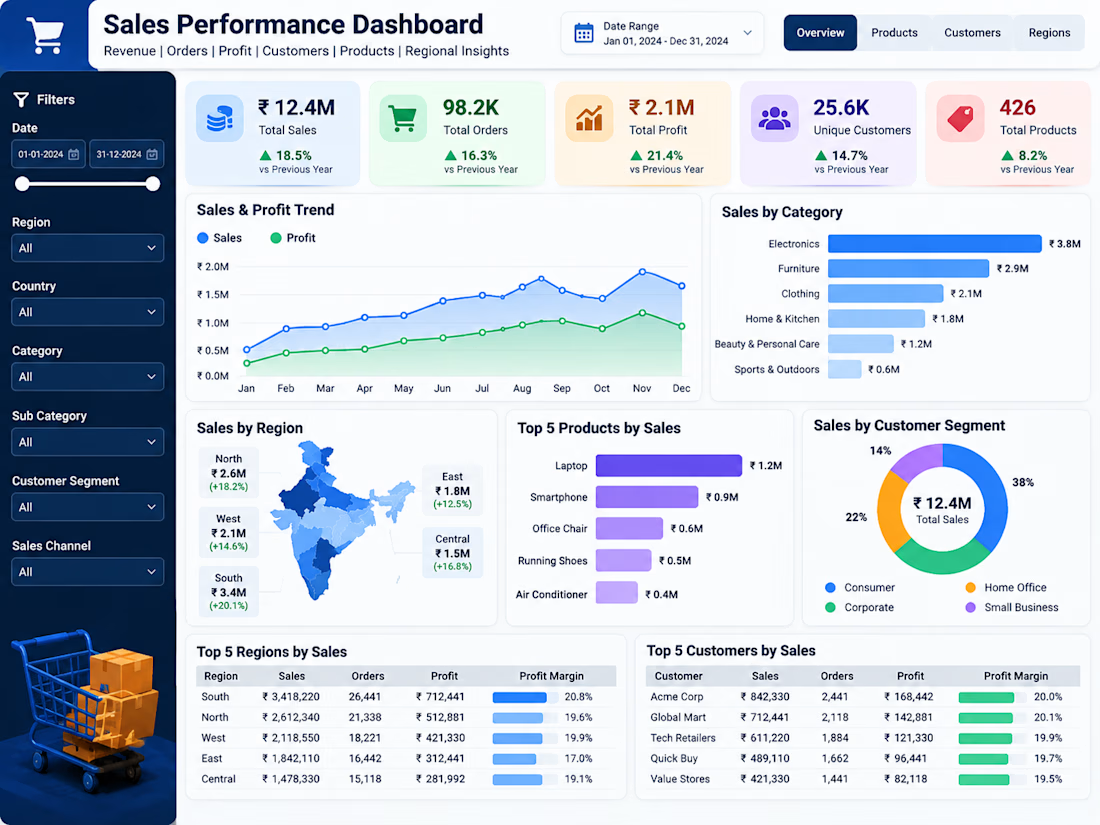
Built a Sales Performance Dashboard in Power BI to analyze revenue, orders, profit, customers, products, and regional performance. The dashboard highlights sales and profit trends, top-performing products and customers, category performance, customer segments, and profit margins through interactive business-focused visualizations. This is a self-initiated portfolio project created using sample data.


The network for creativity
Join 1.25M professional creatives like you
Connect with clients, get discovered, and run your business 100% commission-free
Creatives on Contra have earned over $150M and we are just getting started
Related posts


Mobile dashboard sheet interaction for sales automation platform

One produc Multiple experiences One cohesive design system
Meet TEAMIO a product I designed from the marketing website to the partner dashboard, bringing the entire experience together through thoughtful UX and consistent UI
Which screen is your favorite?


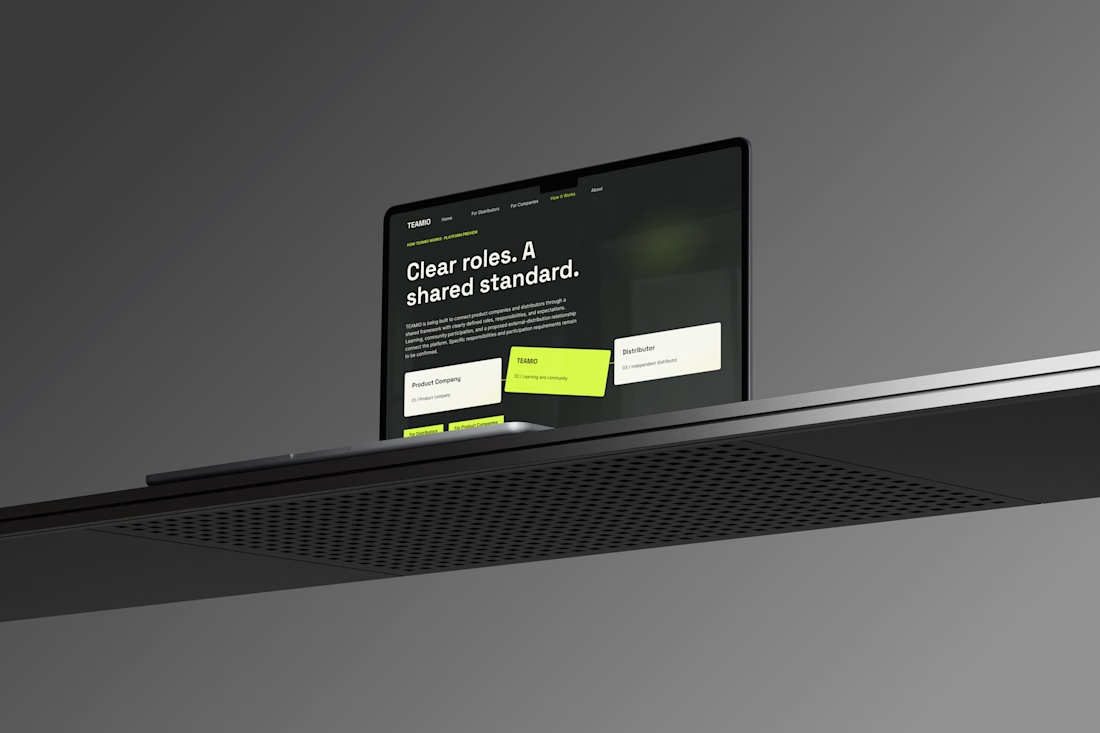
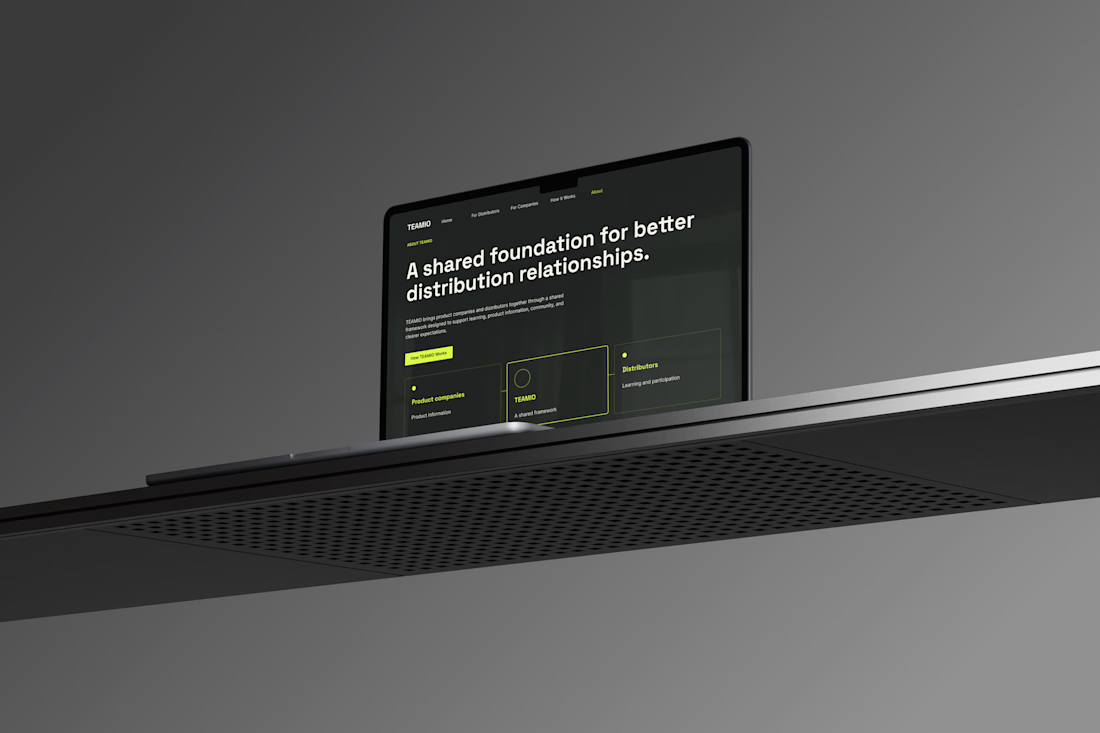


I like the colour combinations and the website vibes it's super elegant but still very creative 👏✅

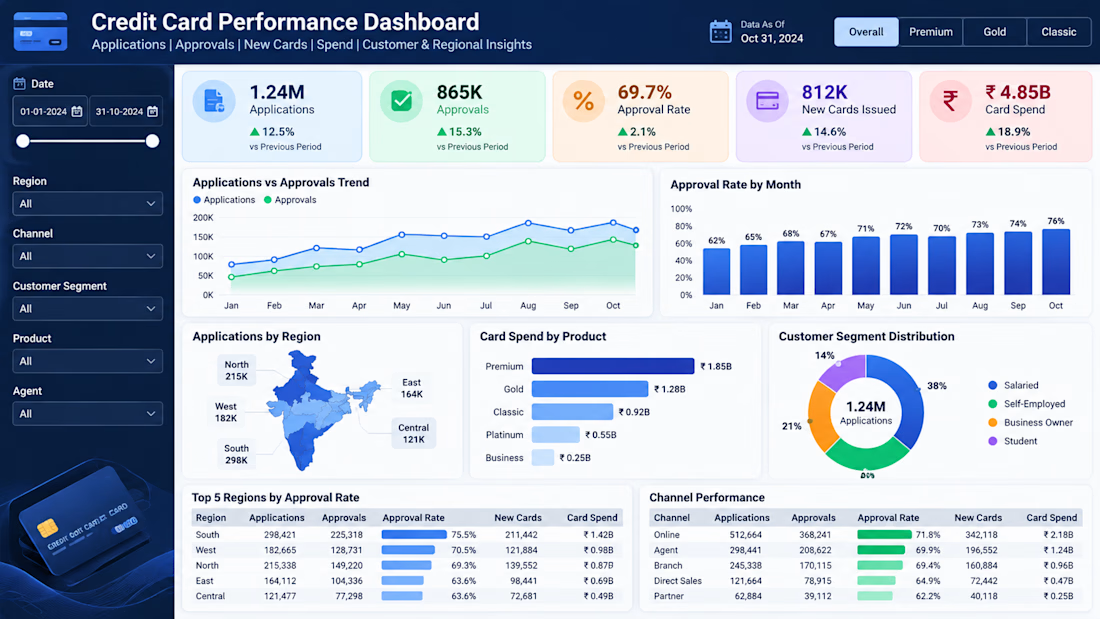
Designed a Credit Card Performance Dashboard in Power BI to analyze applications, approvals, approval rates, card spend, and customer trends. Built interactive KPIs, filters, and visualizations to provide clear insights across regions, products, channels, and customer segments. This is a self-initiated portfolio project created using sample data.