The network for creativity
Join 1.25M professional creatives like you
Connect with clients, get discovered, and run your business 100% commission-free
Creatives on Contra have earned over $150M and we are just getting started
Back to feedPost
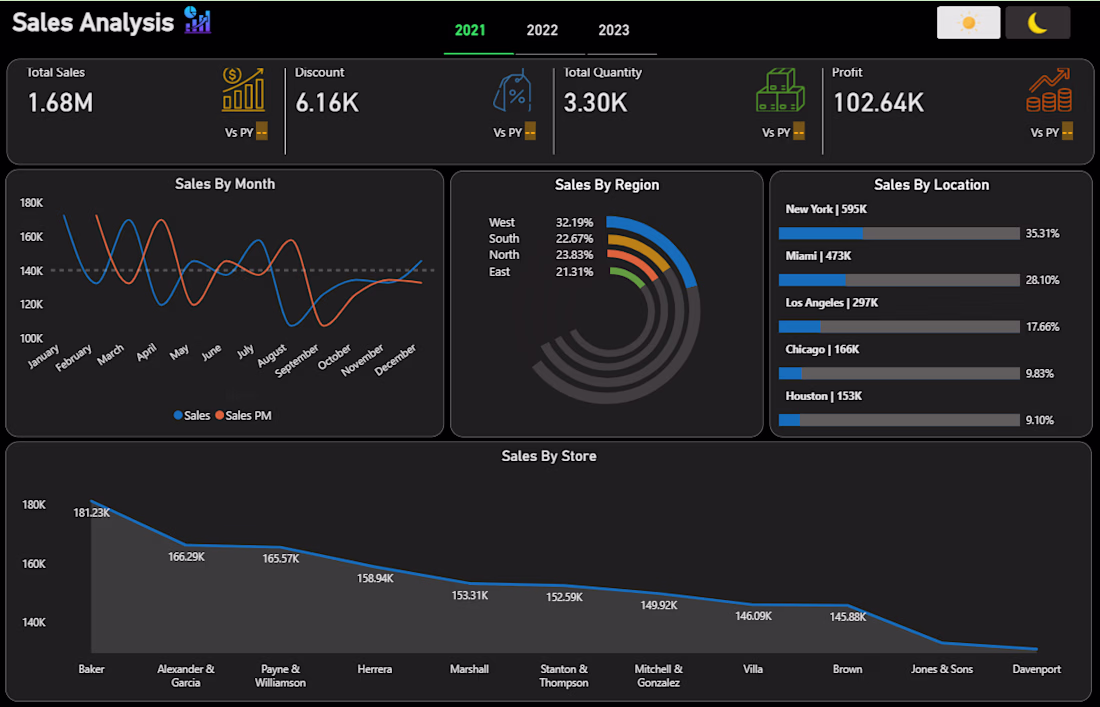
1. Sales Performance Dashboard (Power BI)
Overview:
Designed an interactive Sales Analytics Dashboard to provide executives with a real-time view of sales performance across regions, locations, and stores.
Key Features:
Revenue, profit, quantity, and discount KPIs
Year-over-Year comparison analysis
Monthly sales trend monitoring
Regional and location-based performance tracking
Store-level sales ranking and benchmarking
Dark-mode responsive design
Tools Used:
Power BI, DAX, Power Query, Data Modeling
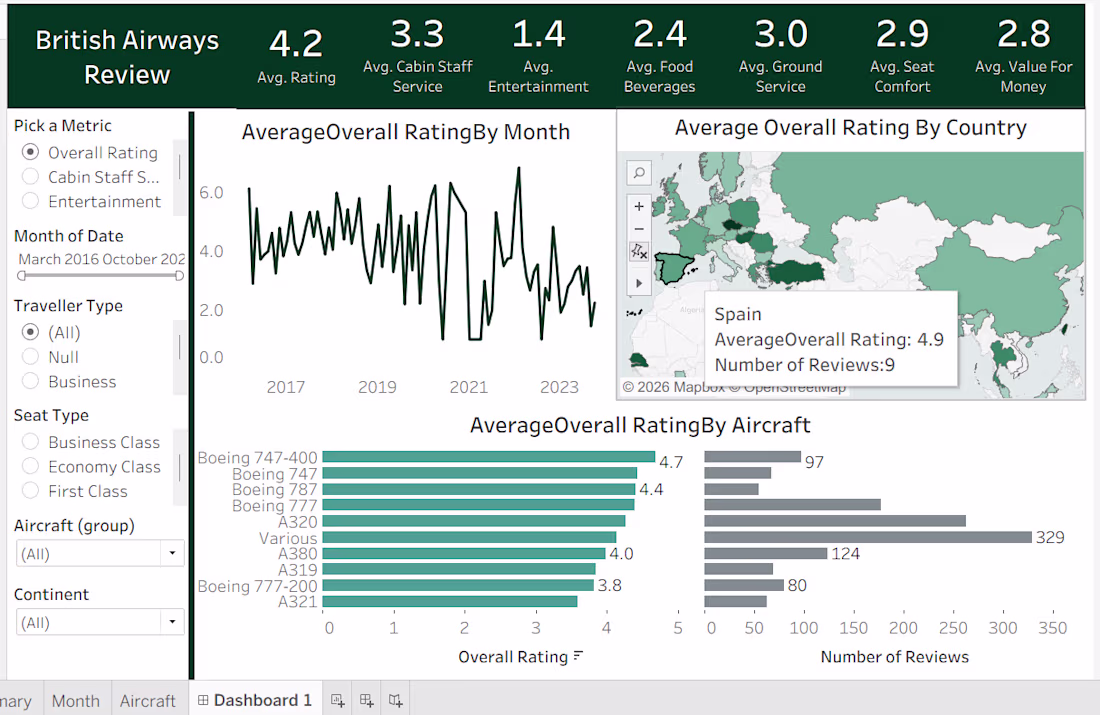
2. British Airways Customer Review Analysis (Tableau)
Overview:
Built a customer sentiment and review analytics dashboard to help stakeholders understand passenger satisfaction trends across aircraft types, regions, and traveler segments.
Key Features:
Overall customer satisfaction analysis
Interactive geographic review mapping
Aircraft performance comparison
Traveler type and seat class segmentation
Historical rating trend analysis
Dynamic filtering and drill-down capabilities
Tools Used:
Tableau, Data Visualization, Data Analytics
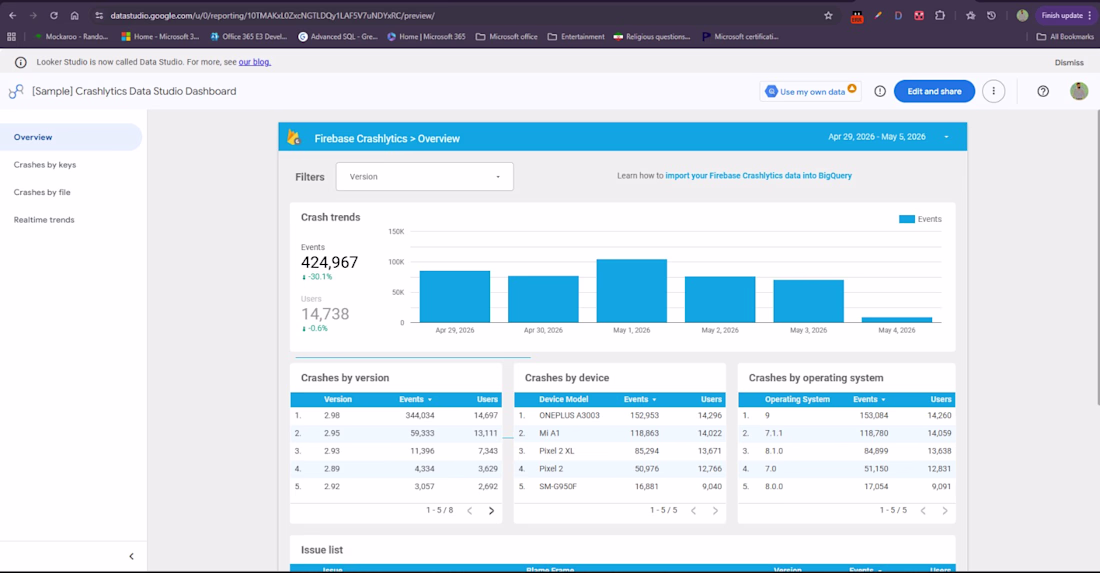
3. Loan Portfolio & Risk Analytics Dashboard (Power BI)
Overview:
Developed a comprehensive lending analytics solution to monitor loan performance, repayment behavior, revenue generation, and portfolio risk.
Key Features:
Loan application and funding metrics
Revenue and profitability tracking
Bad loan and default analysis
Loan status distribution monitoring
State-level performance analysis
Loan purpose and repayment insights
Business Impact:
Enabled stakeholders to identify risk exposure, optimize lending decisions, and monitor portfolio health through a centralized reporting platform.
Tools Used:
Power BI, DAX, Power Query, Financial Analytics
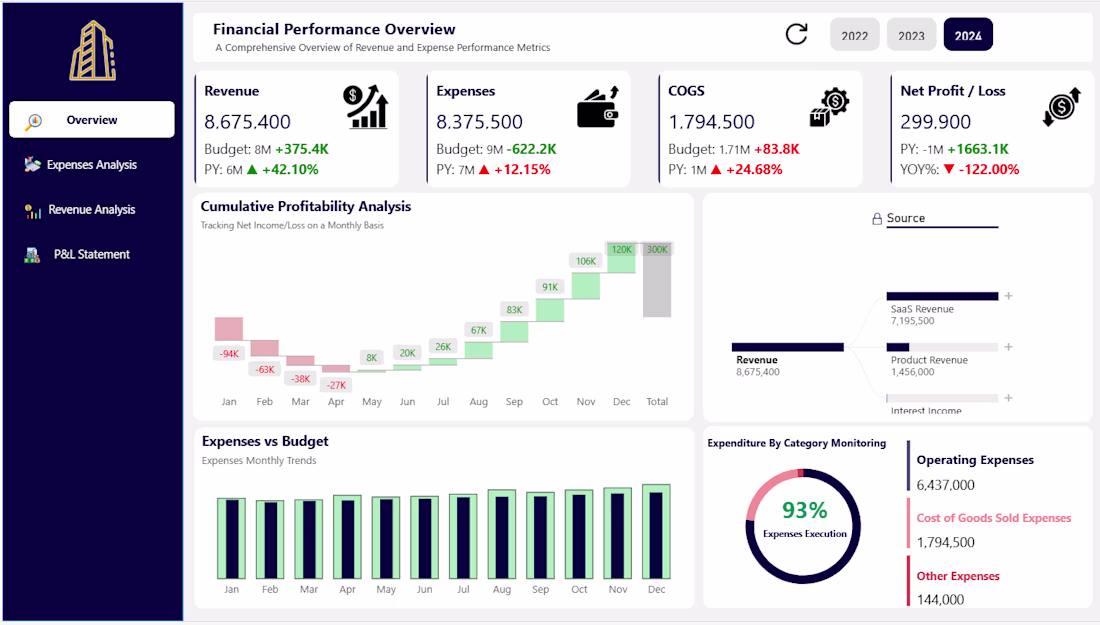
4. Financial Performance Dashboard (Power BI)
Overview:
Created an executive-level financial dashboard providing a complete overview of revenue, expenses, profitability, and budget performance.
Key Features:
Revenue, expenses, COGS, and profit tracking
Budget vs Actual analysis
Year-over-Year performance comparison
Profitability waterfall analysis
Revenue source contribution breakdown
Expense monitoring and category analysis
Interactive period selection and KPI monitoring
Business Impact:
Helped management track financial health, identify cost-saving opportunities, and make data-driven strategic decisions.
Tools Used:
Power BI, Financial Reporting, DAX, Data Modeling
The network for creativity
Join 1.25M professional creatives like you
Connect with clients, get discovered, and run your business 100% commission-free
Creatives on Contra have earned over $150M and we are just getting started
Related posts


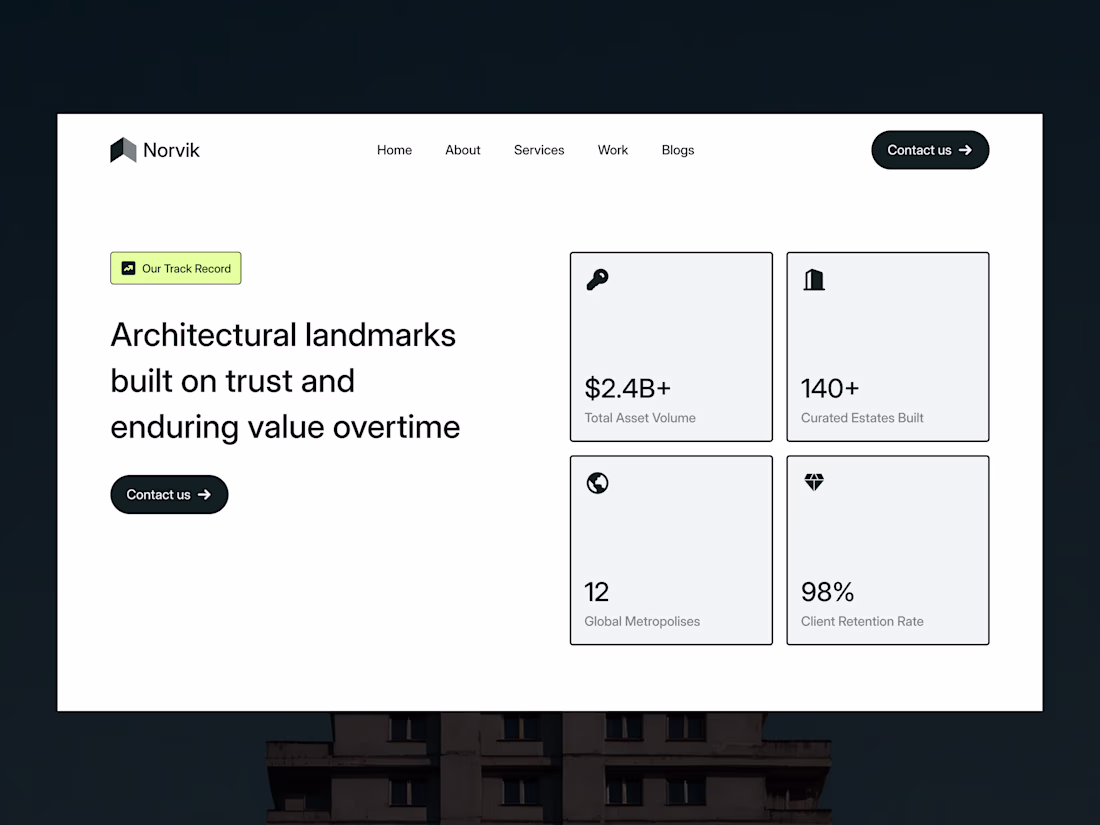
Clean shop
Stat section for Norvik, A Real estate website i just finished working on
Need a landing page in Framer? send a DM or Let's create together here : https://calendly.com/book-a-15mins-call/theframerdude
This is cool brr One of the best design have seen so far today... Keep up the great work
Client pays me $500 for this design + framer dev
Note:
$500 is the old pricing, new pricing for a landing page starts from $2.3k
Thanks for the info brrrr..... Any tips on how to get my first client
Trending
Claude
Claude has entered the design space. How are you using Claude Design?
Contra University
Learn from expert creatives how to earn more using next-gen AI tools.
MagicPath
The canvas is infinite, and exploration is becoming the workflow. How are you using MagicPath?
creativeaiflow
Creative AI workflows are evolving. What tools do you use, and what are their strengths and weaknesses?
freelancerlife
Freelancer life is wins, pivots, and everything in between. What’s yours right now?