The network for creativity
Join 1.25M professional creatives like you
Connect with clients, get discovered, and run your business 100% commission-free
Creatives on Contra have earned over $150M and we are just getting started
Back to feedPost

An interactive Power BI dashboard designed to provide clear graphical insights into coffee sales performance and customer purchasing patterns.
The dashboard analyzes:
Total Sales – overall coffee sales performance
Total Cups Sold – total number of cups sold
Monthly Sales KPI – tracks sales performance by month
Sales by Month – identifies monthly sales trends
Sales by Time of Day – compares morning, afternoon, and evening/night sales
Sales by Product – identifies which coffee products generate the highest sales
Product Performance by Time of Day – shows which coffee products perform best during morning, afternoon, or night
The interactive visuals make it easy to identify top-selling coffee products, peak sales periods, and monthly performance trends, helping management understand customer purchasing behavior and make better sales decisions.
Key value:
Sales data → KPI analysis → Interactive visualization → Customer insights → Better sales decisions


The network for creativity
Join 1.25M professional creatives like you
Connect with clients, get discovered, and run your business 100% commission-free
Creatives on Contra have earned over $150M and we are just getting started





Related posts

Renewable energy production changes constantly, and grid operators need faster ways to understand what is happening across load, generation, storage, and market conditions.
Gridora explores a SaaS dashboard experience built for energy forecasting and balancing.
The dashboard surfaces forecasted peak load, curtailment risk, available storage, spot market price, generation sources, and recommended next actions in one clear workspace.
Natural imagery, soft neutral surfaces, and green accents connect the interface to the renewable energy context while keeping the product practical and easy to scan.




Love the cute concept! The logo icon and mockups feel so cozy and welcoming ☕✨

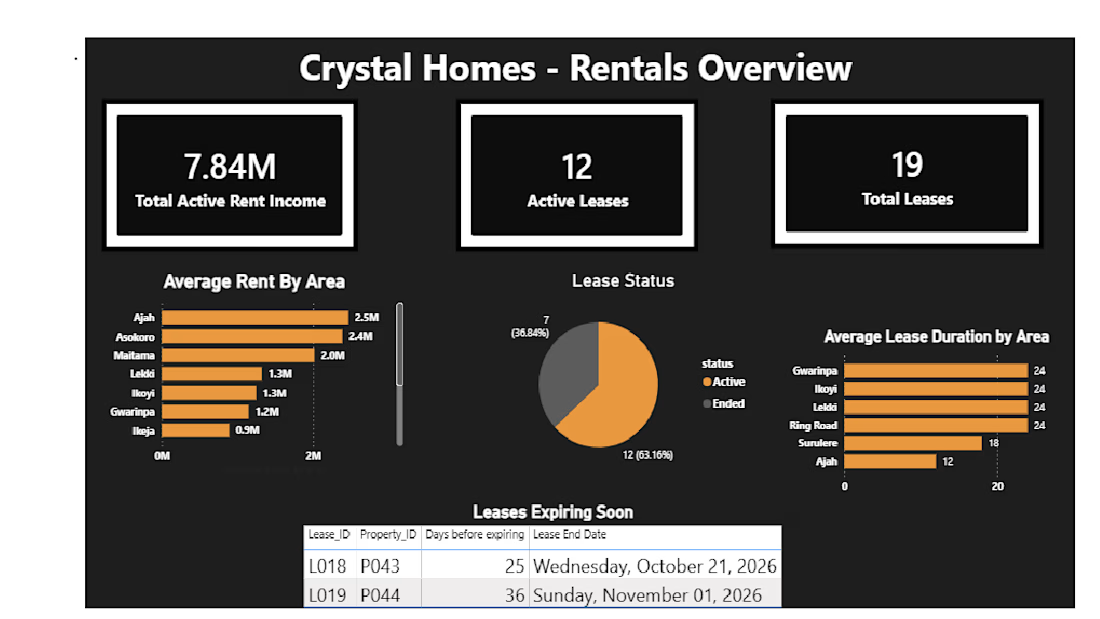
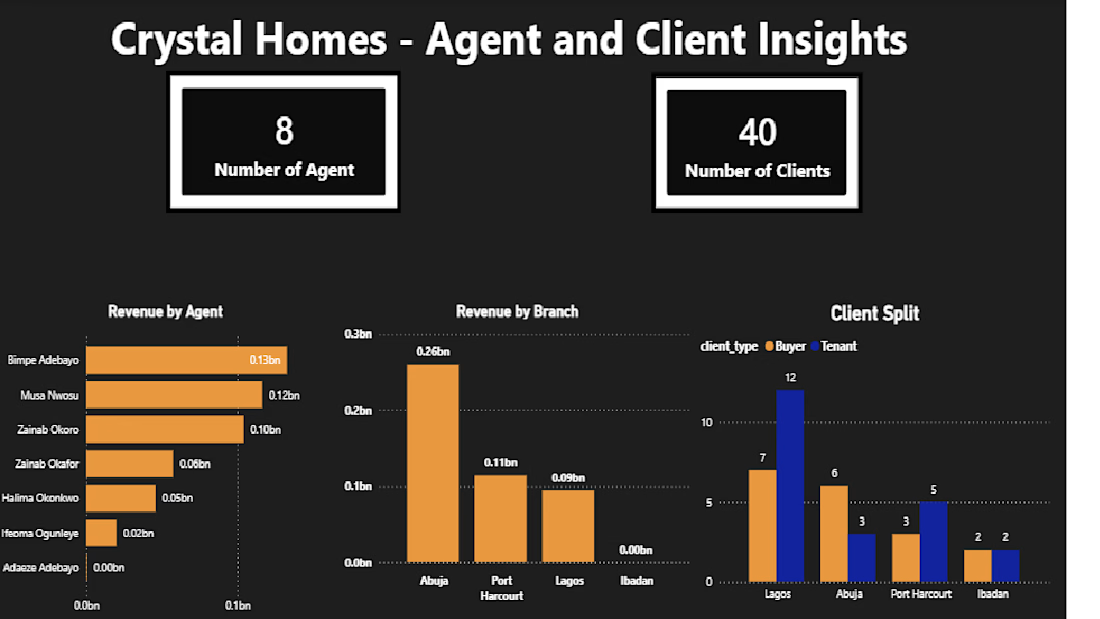
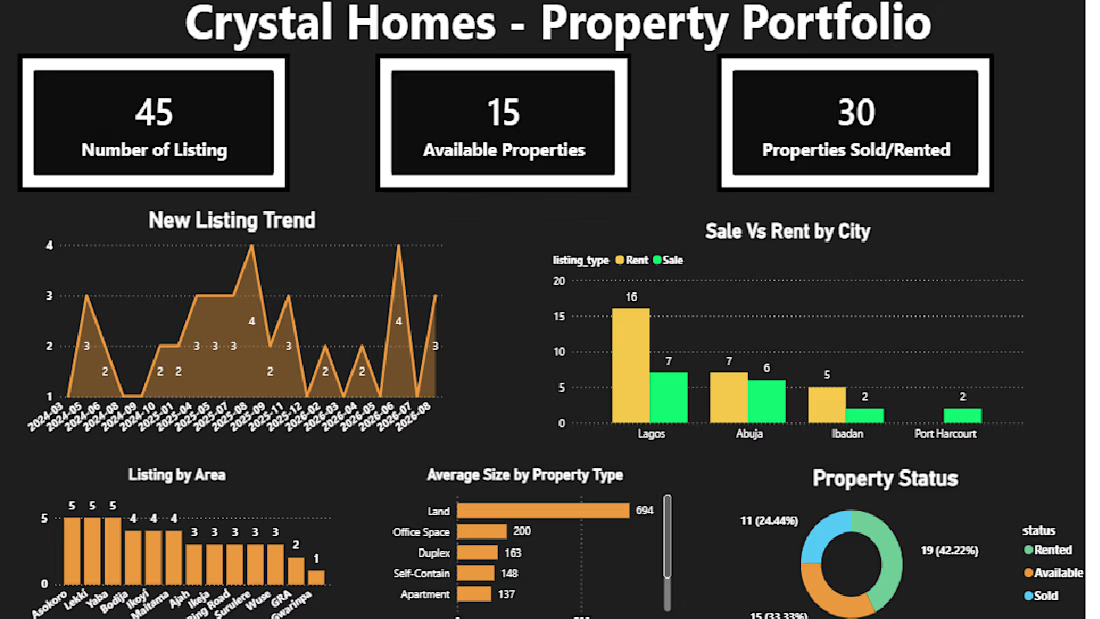
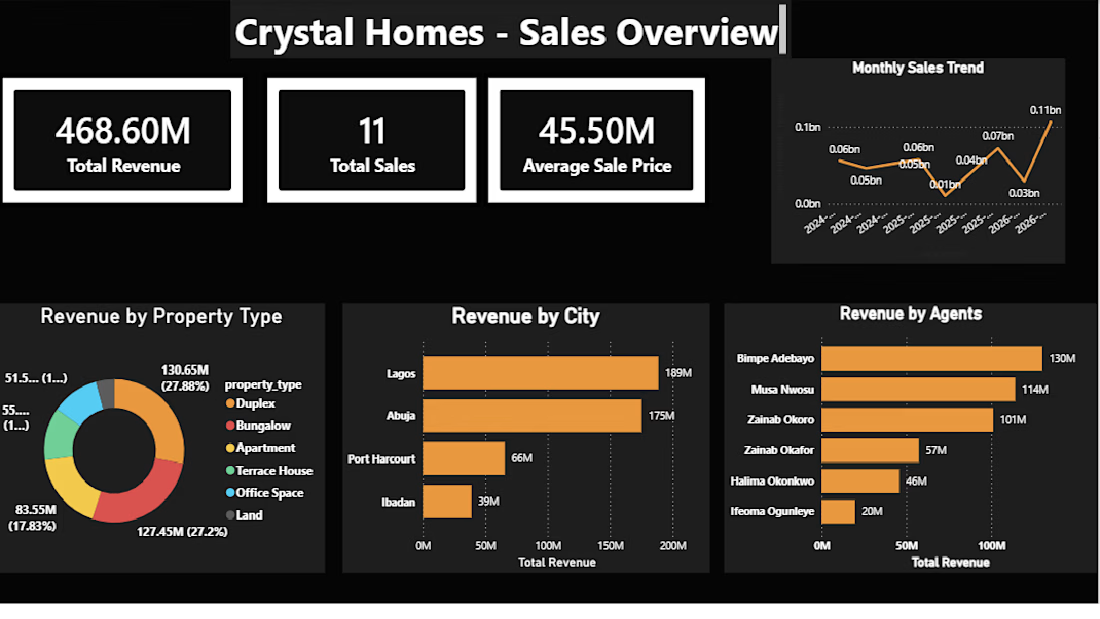
Crystal Homes: Real Estate Sales and Rental Analytics Dashboard
End-to-end analytics project for a fictional Nigerian real estate agency. Raw data from Google Sheets went into MySQL, where I built 21 SQL views, then into a 4-page Power BI dashboard covering sales performance, active rental income, lease expiry tracking, portfolio health, and agent/branch performance. It surfaced findings like ₦468M in tracked revenue and cross-branch sales attribution.
Tools: MySQL, Power BI, SQL, Google Sheets