The network for creativity
Join 1.25M professional creatives like you
Connect with clients, get discovered, and run your business 100% commission-free
Creatives on Contra have earned over $150M and we are just getting started
Back to feedPost

DriftWatch
DriftWatch is an API concept for identifying customers who may be becoming inactive.
Rather than introducing machine learning immediately, I designed the first version around an explainable rules-based scoring system.
The score considers signals such as:
Recent activity
Changes in engagement
Event severity
The approach is intentional.
Without sufficient real-world data, an ML model would add complexity without necessarily adding value.
The initial goal is to establish measurable signals, collect real usage data and use that information to determine whether machine learning is justified later.
The network for creativity
Join 1.25M professional creatives like you
Connect with clients, get discovered, and run your business 100% commission-free
Creatives on Contra have earned over $150M and we are just getting started
Related posts



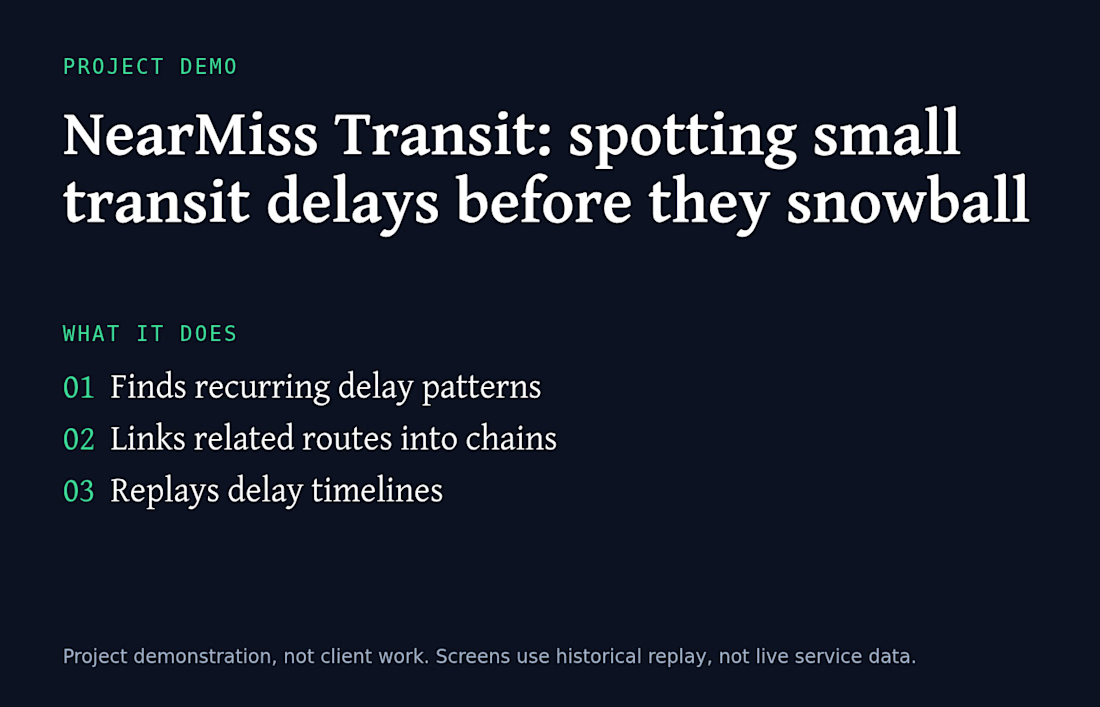
NearMiss Transit: spotting small transit delays before they snowball
The problem
• Delay alerts usually fire after a line has already broken down
• Small delays that repeat on different routes can chain together
The idea
• Look for repeating "near-miss" delays instead of waiting for a failure
What it does
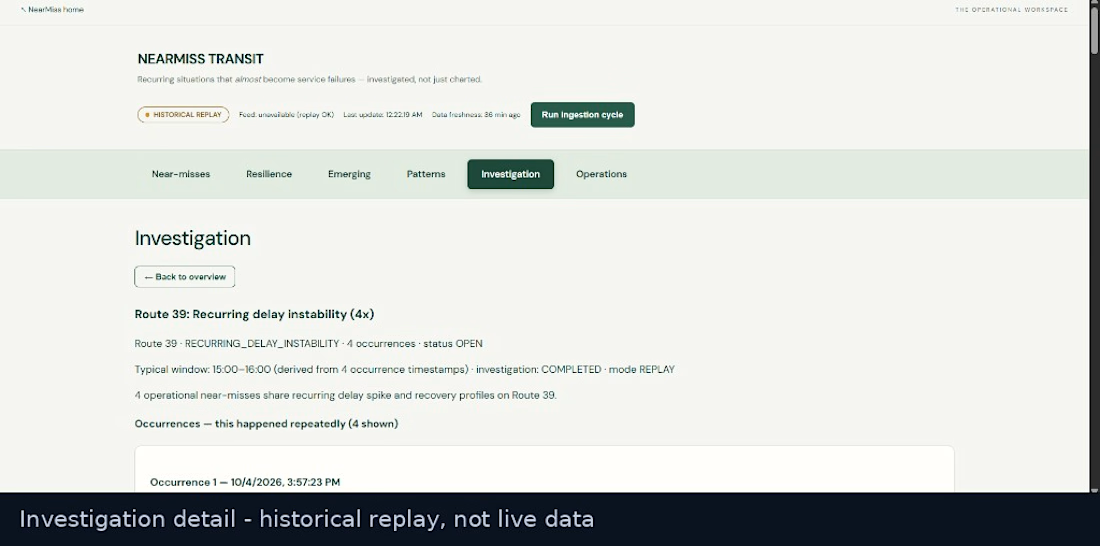
• Finds recurring delay patterns on a route
• Links related routes into chains
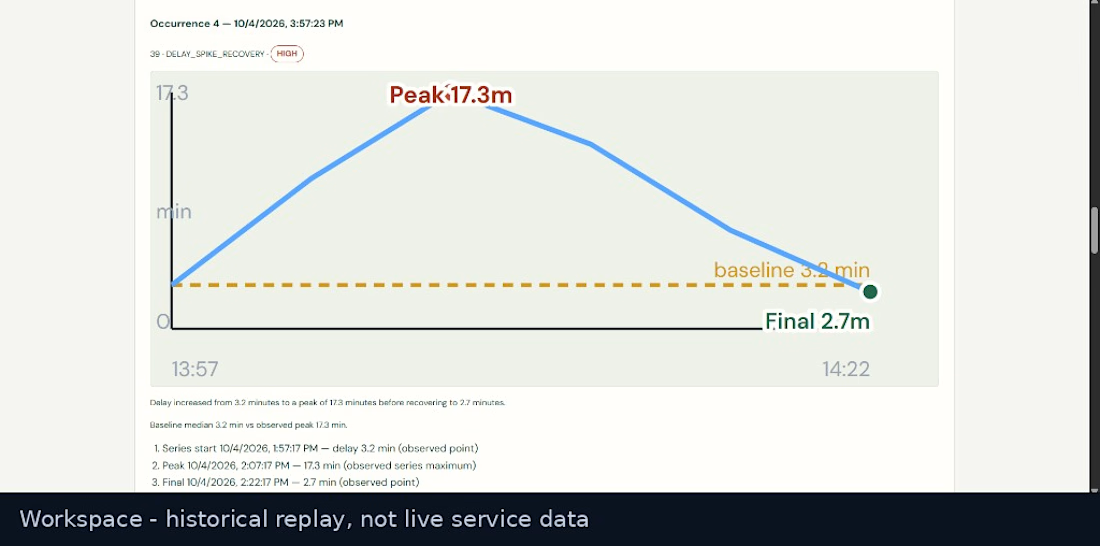
• Replays a delay timeline: start, peak, recovery
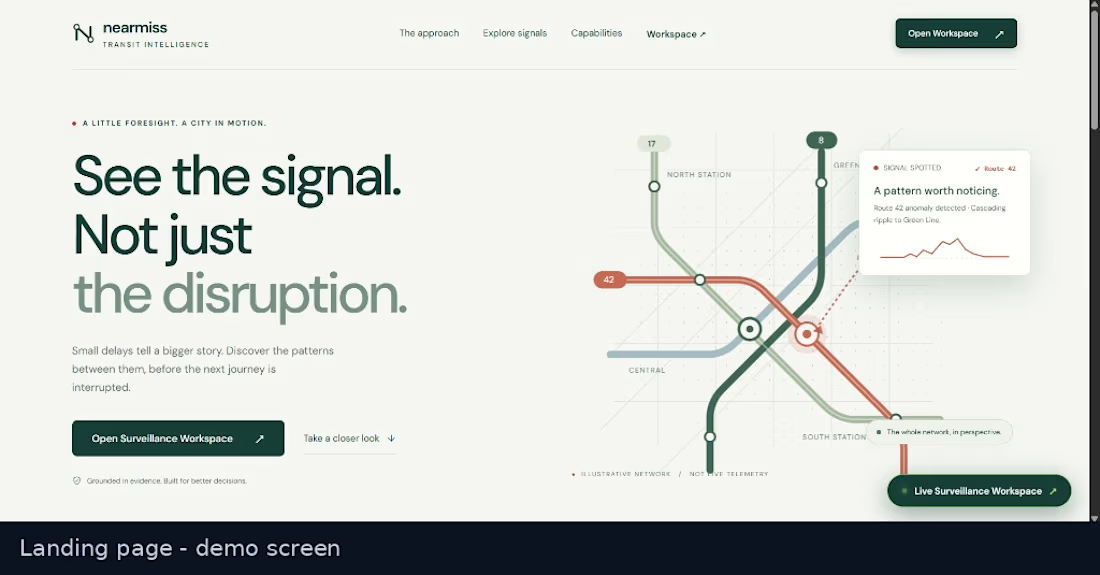
• Workspace dashboard with API docs
Where it stands
• A project demonstration, not client work
• The screens below use historical replay, not live service data
Stack: FastAPI, Python, JavaScript, SQLAlchemy, Vercel
Open to remote full-stack and AI-integration work (Next.js, FastAPI, Python).

Great 👍🏻

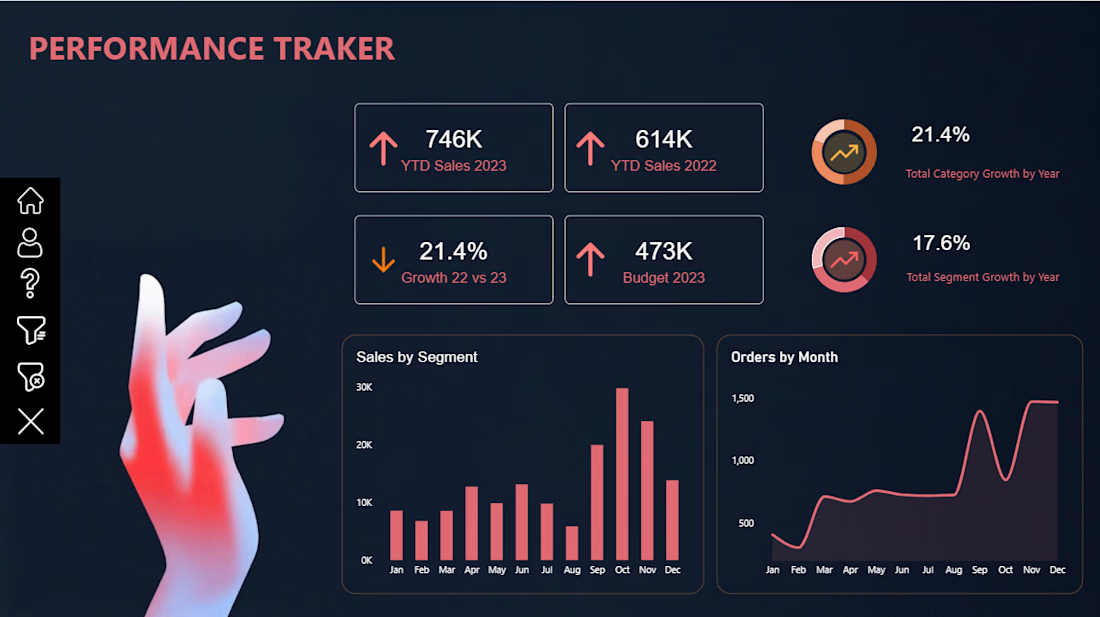
📊 Power BI Performance Tracker Dashboard
Turning raw data into meaningful insights!
I’m excited to share my latest Power BI Dashboard-Performance Tracker, designed to provide a clear and interactive view of business performance.
Key Features:
📈 YTD Sales Performance (2022 vs. 2023)
🎯 Budget vs. Actual Sales Analysis
📊 Sales Growth & Performance KPIs
🗂️ Sales Analysis by Segment
📅 Monthly Order Trends
📉 Category & Segment Growth Analysis
Tools Used: Microsoft Power BI | Data Visualization | Dashboard Design
My goal was to create a clean, modern, and visually engaging dashboard that makes complex business data easier to understand and supports better decision-making.
Always learning, building, and transforming data into insights!
#PowerBI #DataAnalytics #DataVisualization #BusinessIntelligence #DashboardDesign #MicrosoftPowerBI #DataAnalyst #Contra