The network for creativity
Join 1.25M professional creatives like you
Connect with clients, get discovered, and run your business 100% commission-free
Creatives on Contra have earned over $150M and we are just getting started
Back to feedPost

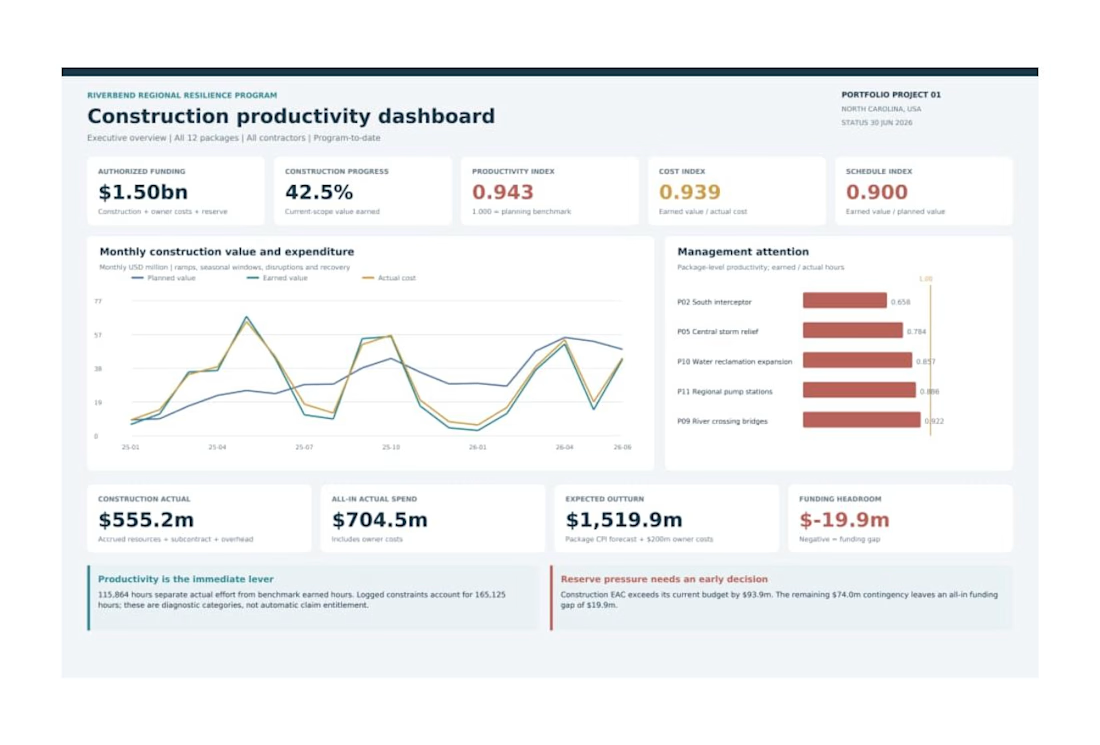
Riverbend Construction Productivity Dashboard: a portfolio analytics project modeled on a $1.5B U.S. infrastructure program spanning 12 construction packages. I built a Python pipeline to clean and reconcile 9,288 daily work records with labor, equipment, materials and delay logs, then developed Power BI reporting with 61 DAX measures covering productivity, earned value, cost forecasts and schedule performance, plus a 38-sheet Excel workbook and a 16-page dashboard report with recovery recommendations.


The network for creativity
Join 1.25M professional creatives like you
Connect with clients, get discovered, and run your business 100% commission-free
Creatives on Contra have earned over $150M and we are just getting started
Related posts


Great stuff! Would love to know what the brief looked like. You clearly took it somewhere special.


Mobile dashboard sheet interaction for sales automation platform

Project: Supermarket Sales & Profitability Dashboard
🔥 Boost Your Supermarket Profits & Eliminate Hidden Losses!🛒
As a supermarket owner, do you want to know which products drive your actual profit and which ones are draining your revenue? This custom interactive dashboard is designed to give you complete financial clarity and control over your store's performance in one single screen.
Key Benefits for Store Owners🔥
1. Instant Business Health Check: Track your total revenue ($2.29M), operational costs ($2.01M), and net profit ($286K) instantly without manual calculation.
2. Identify Profit & Loss Areas: Easily spot which product sub-categories bring maximum profits and which ones cause losses, helping you make smarter stocking decisions.
3. Smart Regional Filtering: Filter your store sales instantly by regions (Central, East, South, West) to see which branches perform the best.
4. Category & Discount Performance: Understand your top-selling categories (Furniture, Office Supplies, Technology) and analyze whether your current discount strategies are actually boosting sales or hurting margins.
5. Geographical Tracking: Monitor your store sales across different geographical ranges to plan future expansions.
👉 Want a custom dashboard like this for your store to grow your sales? Let's connect and discuss your business needs!🔥: