The network for creativity
Join 1.25M professional creatives like you
Connect with clients, get discovered, and run your business 100% commission-free
Creatives on Contra have earned over $150M and we are just getting started
Back to feedPost

Commissioning Tracker & Analytics Dashboard
Developed and enhanced a web-based commissioning tracker and analytics dashboard designed to help monitor asset statuses, tag completion, planned progress, and actual performance across L1 Red Tags, L2 Yellow Tags, and L3 Blue Tags.
Challenge: The project required organizing large amounts of commissioning data into an accessible dashboard while supporting spreadsheet-based updates, multi-level progress tracking, and clear visual comparisons. A key debugging issue involved L2 and L3 actual S-Curves stopping at the TODAY marker while the L1 curve continued into future dates.
Solution: Enhanced the dashboard with interactive filters, dynamic summary cards, system and vendor breakdowns, working-week matrices, Excel upload and parsing, Planned-versus-Actual reporting, and combined or individual S-Curve views. Implemented progress indicators, chart legends, date-based visualization, and comment tracking. Investigated the S-Curve issue by tracing the rendering logic and identifying how zero or missing future cumulative-actual values affected curve continuity.
Project Positioning: A data-driven commissioning dashboard combining web development Excel integration, interactive reporting, and progress visualization to make complex project information easier to monitor and analyze.
websitedevelopmentwebsitedesigndatavisualizationData VisualizationWeb DevelopmentWebsite CSSJavaScriptNetlifySupabase


The network for creativity
Join 1.25M professional creatives like you
Connect with clients, get discovered, and run your business 100% commission-free
Creatives on Contra have earned over $150M and we are just getting started



Related posts

i built a semi-3D interactive website with @Base44 for a Creative Production Studio, called STORM STUDIO,. that drafts 3D Digital unique experience for Brands.
STROM STUDIO specializes indesign, motion, 3D and Technology, working together to turn ambitious ideas into immersive digital experiences.
At STORM STUDIO, We create 3D visual storytelling and interactive web experiences that help brands stand out.
STORM STUDIO - https://stormstudio.base44.app
also, check it out on mobile, to get the full mobile experience
my walkthrough process will be below in my comment section

my walkthrough process
PS; if you opened the STORM STUDIO website on a Mobile phone, Shaking the phone rattles the rubik cubes like a shaken jar.
and,
on PC/DESKTOP, moving the cursor rattles the rubik cubes, also slowly scroll through the home page to have a full experience of the scroll animate effects, etc.
try it out 😊


I finally updated my personal website, and you can actually "dye" your own canvas on it! 🎨
I've been experimenting with how to bring something physical into a digital space. The idea came from my growing interest in natural dyes and traditional textile-making, which I've been exploring a lot lately.
I designed and built the whole experience in one day using Figma, Claude and Netlify. It's been pretty exciting to see how AI makes ideas that once felt technically out of reach something I can now experiment with and build on my own.
I'm also open to fractional creative director roles, so if you know a team building something meaningful, I'd love to connect!
Come play with it, and please let me know if you find any bugs 🐛
mya-nguyen.com


dyeing your own canvas on a personal site is such a nice idea. most portfolios just sit there, this one lets you play

Kajabi Website Design for Online Coaches & Courses
Designed a Kajabi website concept for online coaches and course creators who need a clear, professional way to present their programs and learning offers.
The website focuses on presenting course information, highlighting program benefits, and guiding visitors toward enrollment or the next step. The layout combines clear content structure, engaging sections, responsive design, and strategically placed calls to action to create a smooth experience across desktop and mobile.
The goal is to help coaches communicate the value of their programs and give prospective students a clear path from discovering the offer to taking action.
#Kajabi #KajabiWebsiteDesign #WebsiteDesign #OnlineCourse #CourseCreator #OnlineCoaching #CoachingWebsite #CourseWebsite #LandingPageDesign #SalesPageDesign #WebDevelopment #Elearning

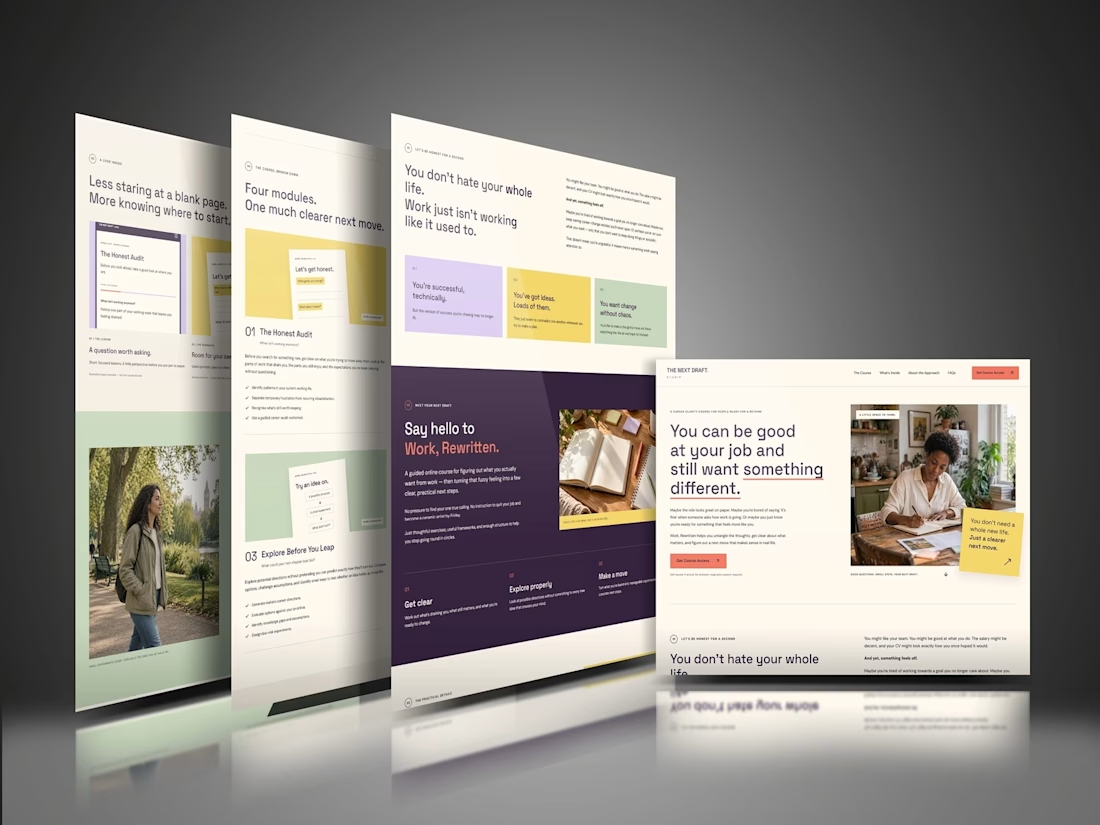

The “Four modules. One much clearer next move.” line makes the course feel manageable before someone gets into the details. That’s a useful choice for coaches whose offers can otherwise feel overwhelming. For this concept, would the main CTA go straight to enrollment, or let visitors preview a lesson first?