The network for creativity
Join 1.25M professional creatives like you
Connect with clients, get discovered, and run your business 100% commission-free
Creatives on Contra have earned over $150M and we are just getting started
Back to feedPost
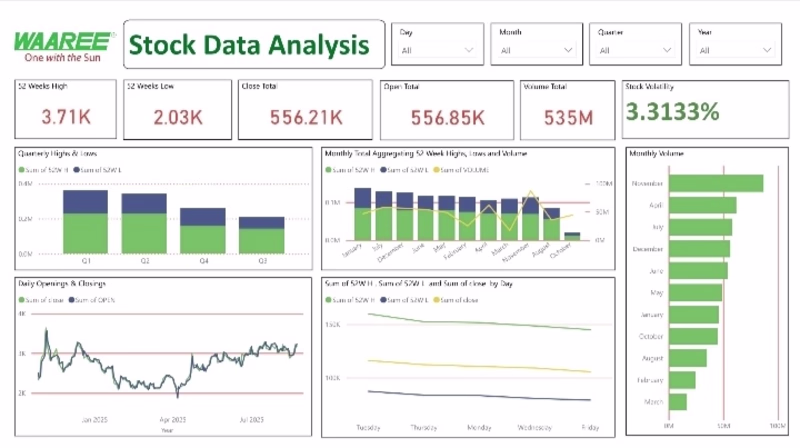
Developed an interactive Stock Data Analysis Dashboard using Power BI to track and analyze stock performance over time. The dashboard provides clear insights into price trends, volume movement, volatility, and high–low performance across different time periods.
Thank you
The network for creativity
Join 1.25M professional creatives like you
Connect with clients, get discovered, and run your business 100% commission-free
Creatives on Contra have earned over $150M and we are just getting started
Trending
Claude
Claude has entered the design space. How are you using it?
Contra University
Learn from expert creatives how to earn more using next-gen AI tools.
Brand Design
The best brand designers are on Contra. Scroll to see what's trending in brand design. What are you building?
creativeaiflow
Creative AI workflows are evolving. What tools do you use, and what are their strengths and weaknesses?
freelancerlife
Freelancer life is wins, pivots, and everything in between. What’s yours right now?
Related posts
Sundays is an AI-powered project management dashboard designed to simplify planning, automate workflows, and help teams stay aligned. Generate intelligent workflows, organize projects, assign tasks, and track progress through a clean, productivity-focused interface. Designed for modern SaaS teams looking to streamline operations with AI.

Great visual direction!
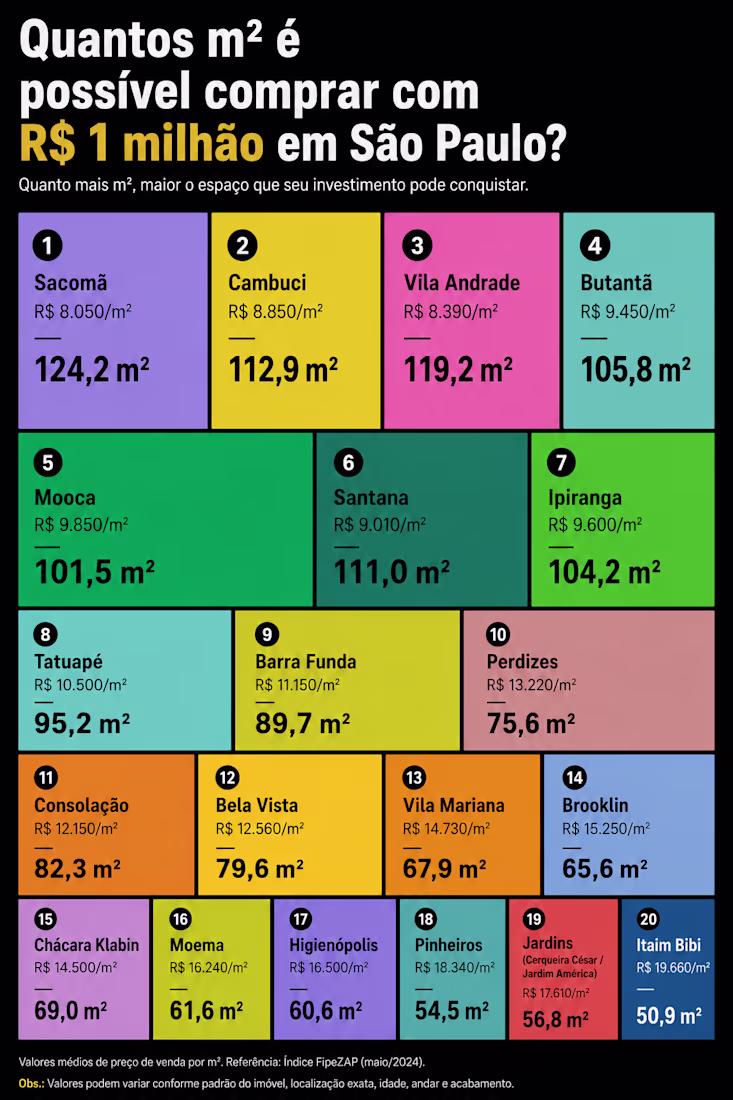
How much can $1 million buy across different neighborhoods in São Paulo?
This market analysis compares estimated price-per-square-meter levels across 20 neighborhoods in São Paulo, highlighting how the same investment budget can translate into significantly different property opportunities depending on location.
The analysis considers the differences in market positioning, urban development, infrastructure, mobility, and local demand — key factors when evaluating real estate opportunities.
This type of comparative analysis can support investors, developers, and real estate professionals in identifying market patterns and making more informed decisions.
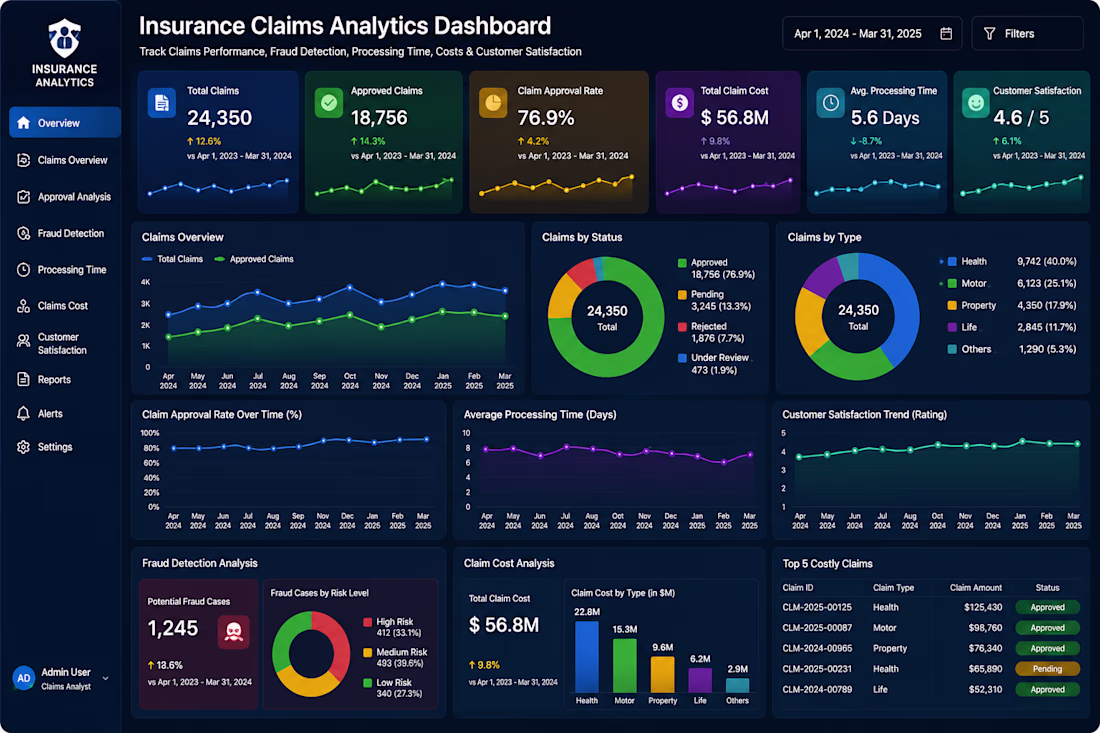
🏦 Insurance Claims Analytics Dashboard
Description:
Built a professional Insurance Claims Analytics Dashboard to help insurance companies streamline claims management, monitor operational performance, detect fraud, and improve customer satisfaction through data-driven insights.
This dashboard provides a complete overview of Claims Overview, Claim Approval Rate, Fraud Detection, Processing Time, Claim Cost Analysis, Customer Satisfaction, and Executive KPIs with interactive visualizations and real-time reporting. It enables insurance teams to identify claim trends, reduce processing delays, minimize fraudulent activities, optimize claim costs, and enhance overall operational efficiency.
Developed using Microsoft Power BI, SQL, and Microsoft Excel, this solution transforms complex insurance data into meaningful business intelligence through dynamic dashboards, KPI cards, drill-through reports, and executive-level analytics, empowering organizations to make faster and more informed decisions.
Key Features
🏦 Claims Overview & Executive KPIs
✅ Claim Approval Rate Analysis
🔍 Fraud Detection & Risk Monitoring
⏱️ Claim Processing Time Analysis
💰 Claim Cost & Financial Insights
⭐ Customer Satisfaction Tracking
Client Note
Looking for a custom Insurance Analytics Dashboard tailored to your business? I build clean, interactive, and executive-level Business Intelligence solutions that transform raw insurance data into actionable insights. Every dashboard is designed to improve operational efficiency, reduce claim processing time, support fraud detection, and enable smarter business decisions. If you need a customized solution for your organization, feel free to get in touch to discuss your project requirements.