The network for creativity
Join 1.25M professional creatives like you
Connect with clients, get discovered, and run your business 100% commission-free
Creatives on Contra have earned over $150M and we are just getting started
Back to feedPost

The network for creativity
Join 1.25M professional creatives like you
Connect with clients, get discovered, and run your business 100% commission-free
Creatives on Contra have earned over $150M and we are just getting started





Related posts

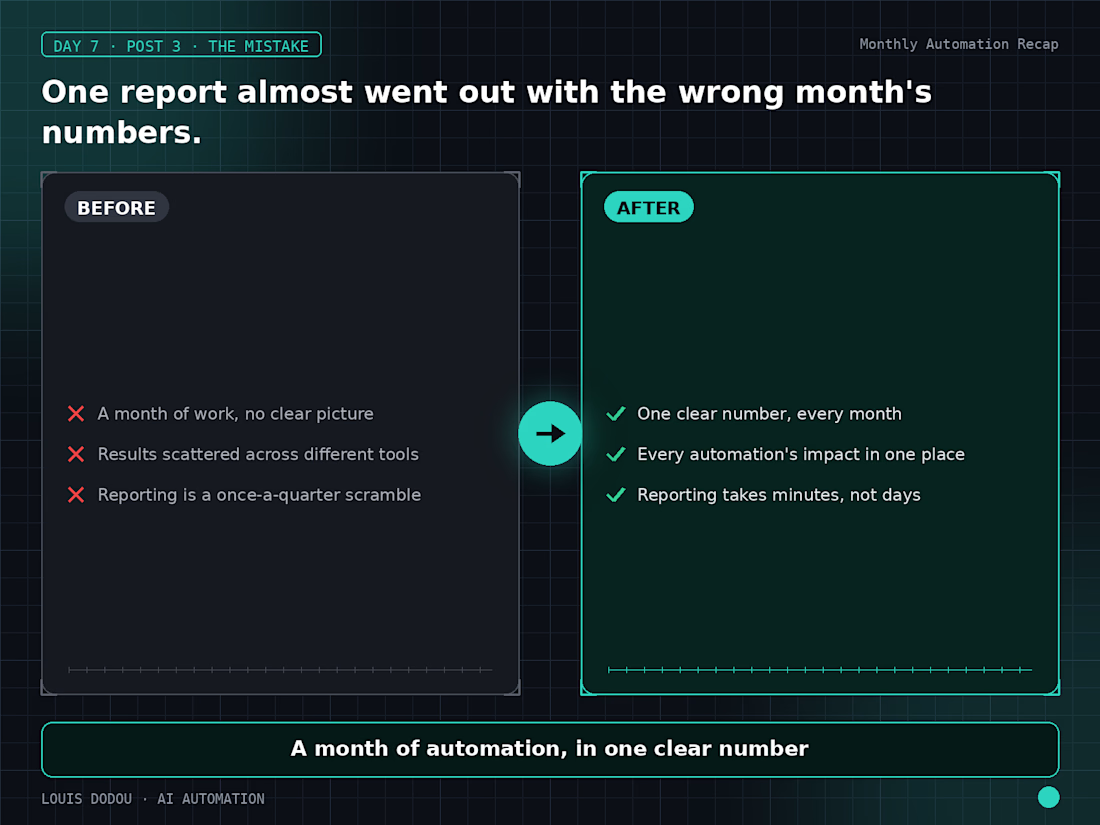
One report almost went out with the wrong month's numbers.
A dashboard hadn't refreshed before the export ran. Caught it before it sent now every report confirms the data's freshness before it goes out, not after.
→ Automating the report still needs one manual check: is this actually current?



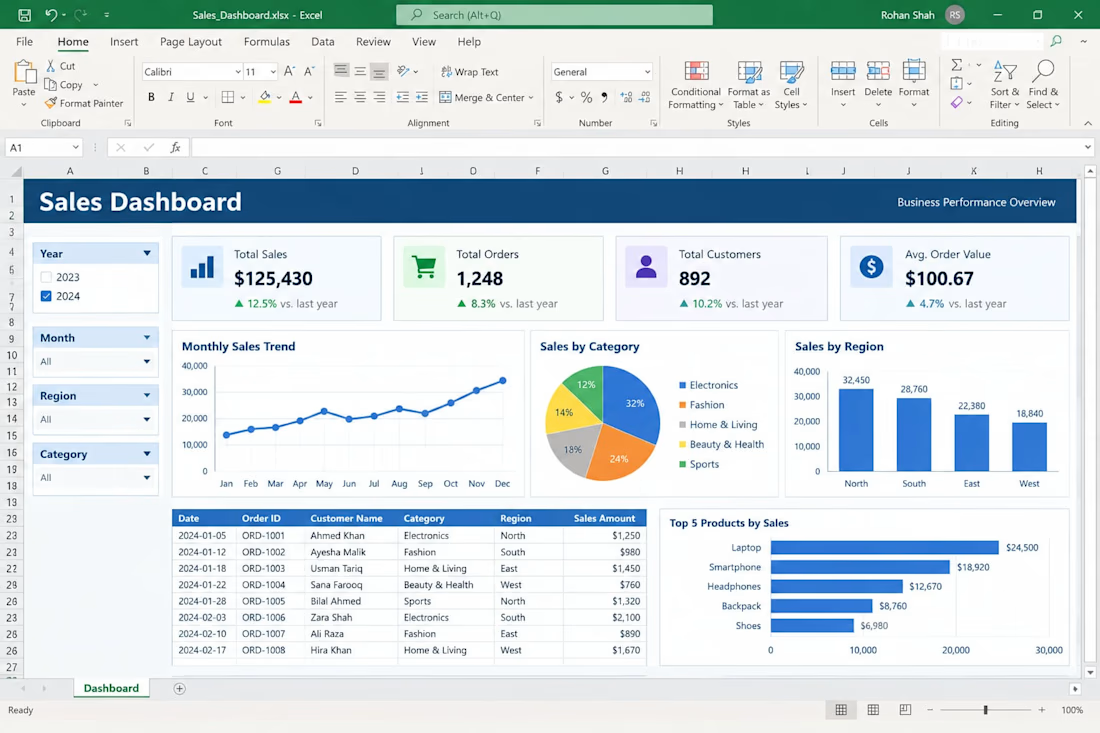
Created an interactive Excel dashboard to track sales performance, KPIs, trends, and category insights.
Used charts, filters, and data analysis techniques to convert raw data into clear business reports.


An empty dashboard is the first screen a new account sees.
What changes between the before and after:
1. The headline says what the dashboard is for
2. The sub-headline says what is possible
3. The button names the system to connect
Clear writing means faster time to value
